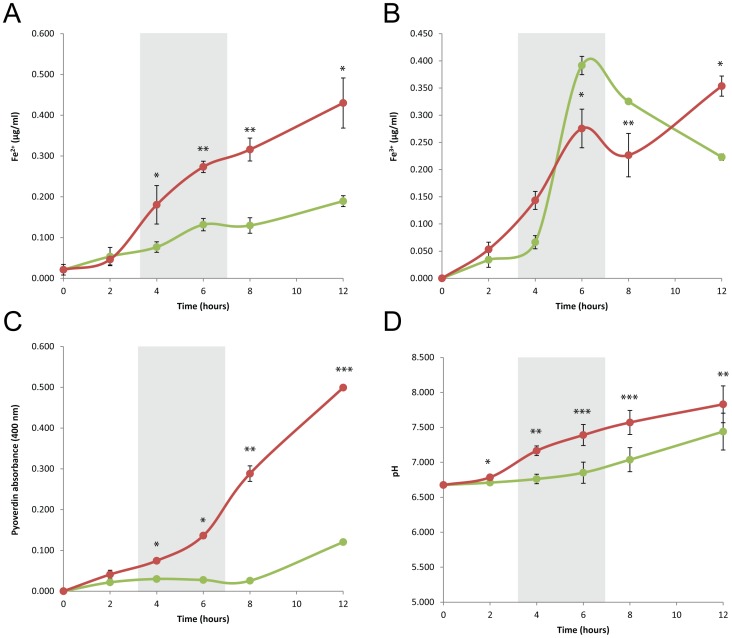
Figure 4. Iron availability, pyoverdin production and pH variation during growth at 22°C and 37°C.
Variations of Fe2+ (A) and Fe3+ (B) levels, pyoverdine production (C) and pH (D) measured during the growth of P. aeruginosa PAO1 in Lysogeny broth at 22°C (green) and 37°C (red). Time frames indicated in grey correspond to the times at which samples were taken for transcriptome analysis. Data collected from six independent cultures were analyzed using a paired two-tailed t-test. Data points that were significantly different are denoted with an asterisk.

