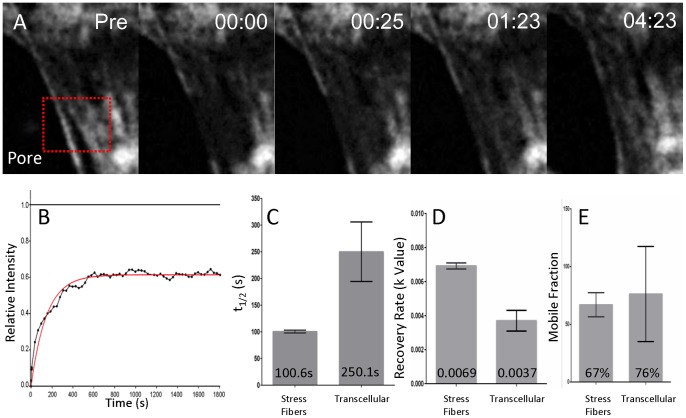
Figure 2. Myosin exchange with the circumferential invasion array.
(A) Representative timelapse images of a FRAP zone (red box) in a transcellular pore. Time = mm:ss. (B) A representative fluorescence recovery curve with relative intensity normalized to pre-bleached level. (C–E) Comparison of t1/2, k value, and mobile fraction between stress fibers and transcellular invasion arrays. n = 8 for each bar. Mean values are displayed on graph.

