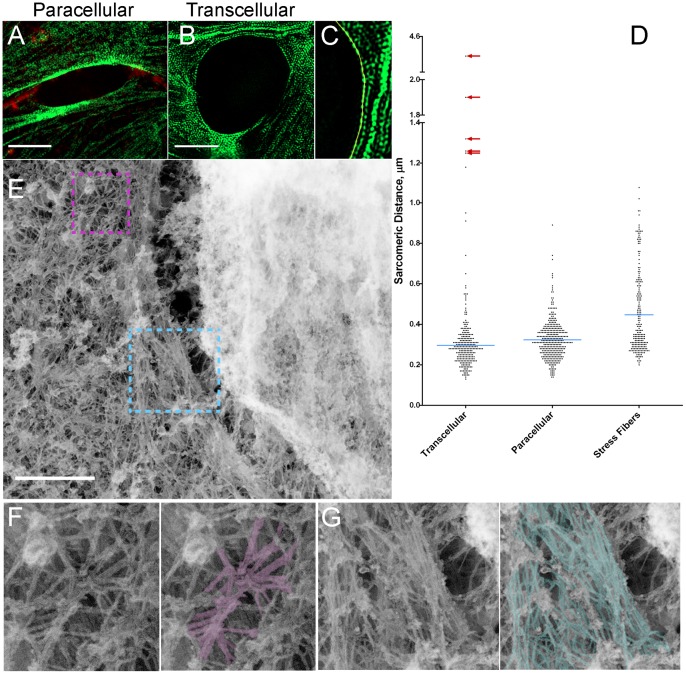
Figure 3. Ultrastructural studies of invasion pore.
(A and B) SIM images of GFP-RLC (green) and VE-Cad (red) in HUVEC. (C) Example of intensity trace for measuring sarcomeric spacing. (D) Scatter plot of sarcomeric distances (n = 264 for transcellular, 368 for paracellular, and 218 for stress fibers). Blue lines, mean distribution. Red arrows show outliers from myosin-denuded areas of invasion arrays which were not included in the analysis. (E) Platinum replica electron microscopy of transcellular invasion. (F and G) Zoomed areas of purple and cyan boxes. Scale bars, 5 μm (A and B) and 500 nm (E).

