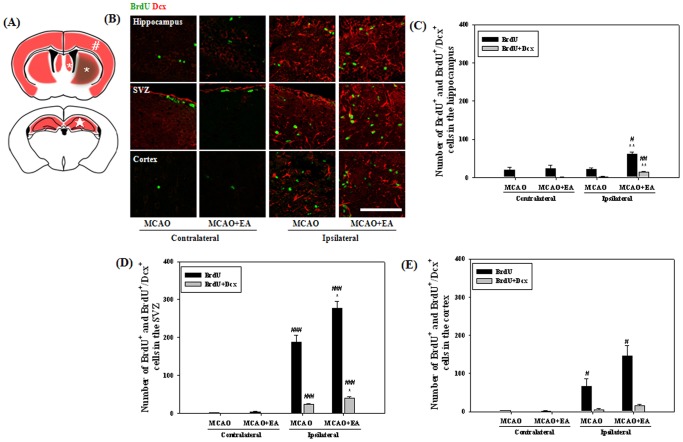
Figure 4. Effects of EA treatment on neurogenesis at 14 days after MCAO.
Schematic diagram shows the regions of the hippocampus (★, in and around the hippocampus), SVZ (*, including the striatum) and cortex (#, the whole cortex) of the brain for immunohistochemical and further Western blot analysis (A). Photomicrograph (B) and its histogram for BrdU/Dcx double-positive cells in the hippocampus (C), SVZ (D) and cortex (E) of the brain. BrdU/Dcx double-positive cells were significantly increased by EA treatment in the hippocampus and SVZ of the ipsilateral hemisphere. # P<0.05, ## P<0.01 and ### P<0.001 versus the contralateral hemisphere; *P<0.05 and **P<0.01 versus MCAO mice. Scale bars = 100 µm.

