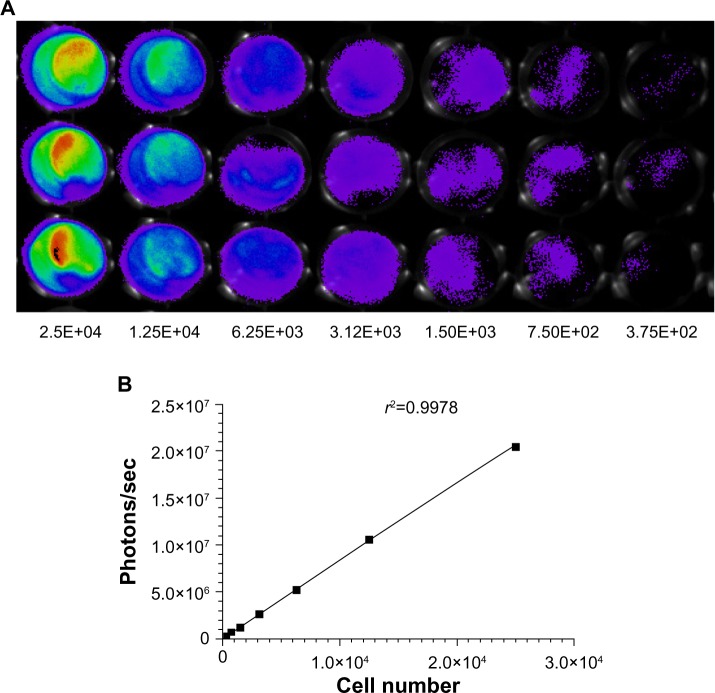
Figure 3.
Measurement of bioluminescence in HCT-116-Luc-GFP cells. HCT-116-Luc-GFP cells were counted with a hemocytometer and plated in a 96-well plate at various concentrations. The plate was imaged to verify that the cells bioluminesced in a concentration-dependent manner. (A) Quantitation of bioluminescence (photons/sec) was graphed. (B) Linear regression analysis showed a good correlation between cell number and mean bioluminescence imaging or fluorescent intensity (r2=0.9978).

