Fig. 6.

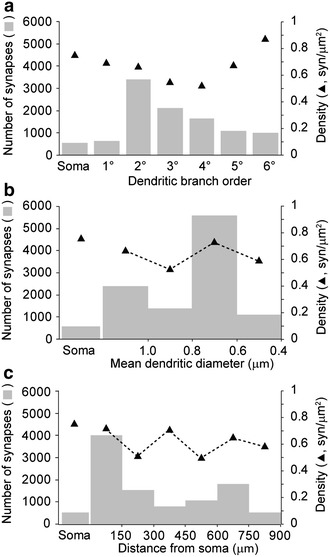
Examples of distribution, number and density of synapses made with a single neuron (a–c). Estimated numbers of synapses (gray bars, left Y axis) and approximate surface-area densities of synapses (triangles, right Y axis) as a function of the location of synapses at the soma or at dendritic segments of increasing branch order (a), increasing mean diameter (b) or increasing distance from soma, as using concentric shells of increasing ratio (150 μm) defined by Sholl analysis
