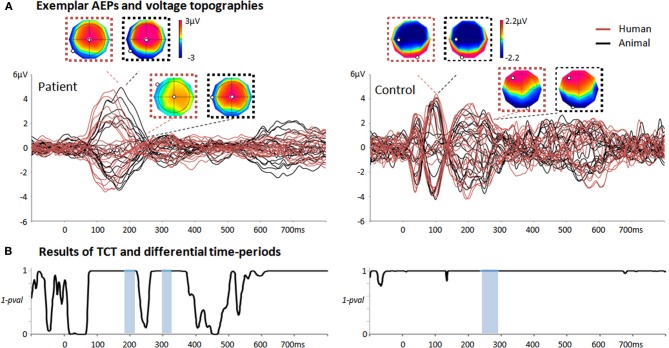
Figure 2.
Summary of the single-trial EEG analysis when comparing responses to animal/human vocalizations in two exemplar individuals. (A) Average auditory evoked potentials of one patient recorded during TH and one control subject in response to human (red) and animal (black) vocalizations. For the patient, the voltage topographies correspond to the first peak of GFP and to the first period of differential activity as evaluated by the single-trial EEG analysis (184–214 ms post-stimulus onset). For the control, the first two voltage topographies correspond to the N100; the second two correspond to the voltage topographies occurring during the period of differential activity identified by the single-trial topographic analysis (237–295 ms post-stimulus onset). The N100 voltage topographies exhibit a prototypical distribution in classical AEP responses (in contrast to the maps of the patient at the same latencies). (B) Results of the TCT for the patient and control subject revealing long-lasting time-periods of evoked responses (i.e., periods of 1-p > 0.999). Periods of differential activity in response to animal and human vocalizations estimated by the single-trial decoding analysis are highlighted in light blue.

