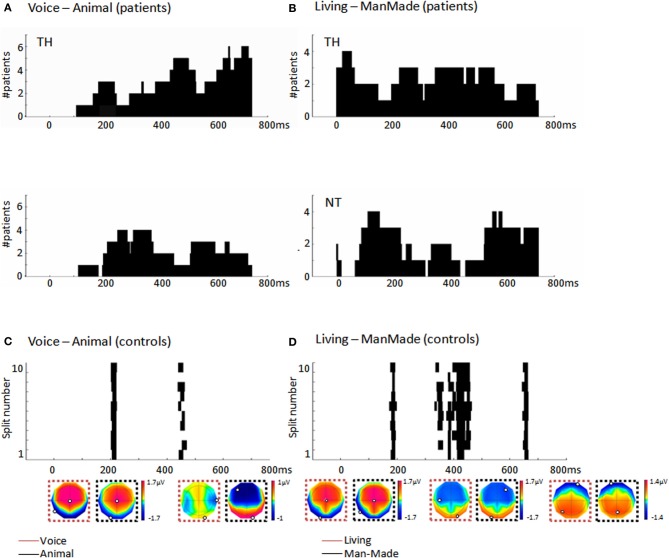
Figure 3.
(A) Histograms (40 ms bins) of the time-periods of differential activity (H, cf. section “Multivariate EEG decoding”) in response to different vocalization types as computed by the single-trial decoding analysis across the significant patients. Top panel: During TH for the human/animal comparison, the most consistent period was at ~450 ms post-stimulus onset, observed in five out of the seven significant patients. Bottom panel: During NT half of the patients showed earlier discriminative periods at ~300 ms (B) Histograms (40 ms bins) of the time-periods of differential activity, H, in response to living and man-made sounds as computed by the single-trial decoding analysis across the significant patients. Top panel: During TH, the living/manmade comparisons provided a consistent period of differential activity starting already at ~50 ms post-stimulus onset in four out of the five patients; Bottom panel: During NT four patients out of six had a consistent period of differential activity between living and man-made sounds around 180 ms post-stimulus onset as well as a later period after 600 ms post-stimulus. (C) Results of the single-trial decoding analysis applied across the group of 10 control subjects and comparing EEG responses to human and animal vocalizations. Each line provides the time period of differential activity, H, in each split of the cross-validation procedure. The first of these time-periods overlapped with what observed in patients during NT around 200 ms. (D) Time periods of differential activity, H, identified by the single-trial decoding analysis across the 10 control subjects when comparing EEG responses to living and man-made sounds. Each line represents the result obtained in each split of the cross-validation. The first of this differential period at 173 ms pos-stimulus onset overlaps with what observed in patients during NT. Mean voltage topographies along the time periods of differential activity are shown for each of the categories (minimum and maximum values are highlighted in each topography).

