Figure 3.

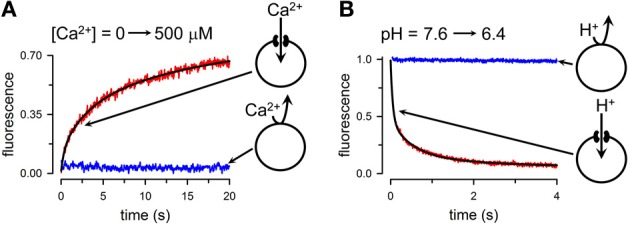
Quantitative transport assays. (A) Rate of Ca2+ influx into liposomes containing purified Cx26 HCs. Extraliposomal free-[Ca2+] was rapidly increased by mixing in a stop-flow cell from a few nM to 500 μM, and the rate of increase in emission from Fluo-5N trapped into the liposomes was followed. Red record: liposomes containing Ca2+-permeable Cx26 HCs; blue record: liposomes without HCs. The black line is a multi-exponential fit to the data used to calculate the rate of Ca2+ influx. (B) Changes in intraliposomal pH followed by the pH-sensitive probe fluorescein attached to a phospholipid head group. Extraliposomal pH was rapidly reduced from 7.6 to 6.4 by mixing in a stop-flow cell, and the rate of decrease in pH was followed by the quenching of the fluorescein bound to the inner leaflet of the liposomes bilayer. The black line is a multi-exponential fit to the data used to calculate the rate of liposome acidification. Modified from Fiori et al., 2012.
