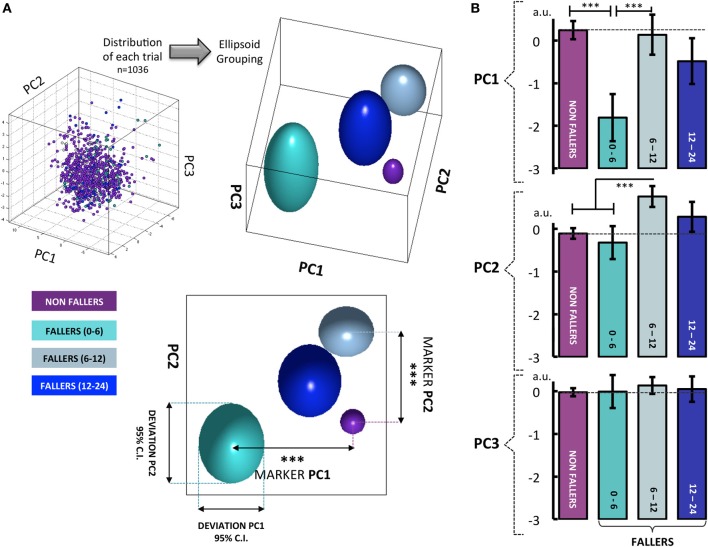
Figure 2.
(A) When results from all walking tests are visualized in a 3-D space defined by the newly constructed variables PC1–3 (57.2% of explained variance), clear differences can be seen between the four groups: non-fallers, fallers from 0 to 6 months, fallers from 6 to 12 months and fallers from 12 to 24 months. For the PC1, the participants who fell from 0 to 6 months show a clear difference in behavior compared to the three other groups. Similarly, when considering the PC2, the fallers from 6 to 12 months can be significantly differentiated from all the other groups. With PC3, no differentiation between groups was found. Note that the group of fallers from 12 to 24 months displays a behavior very similar to the non-fallers group. (B) These visual findings are confirmed by one-way analysis of variance, with the 4 groups used as a differential factor between subjects. The HSD Tukey tests were used as post-hoc tests following significant effects. The histograms represent the mean score of eigenvector for each group with ±95% confidence intervals. Note. *p < 0.05, **p < 0.01 ***p < 0.001.

