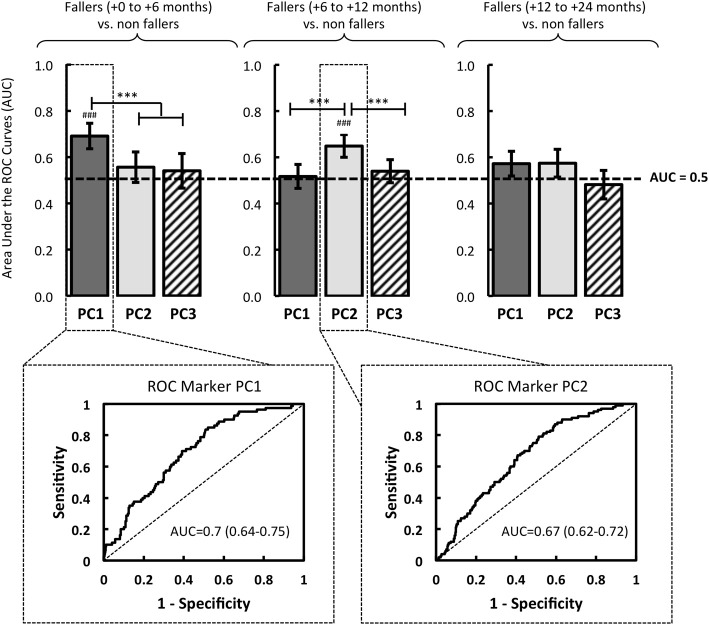
Figure 3.
Based on logistic regressions performed with the eigenvectors of PC1, PC2 and PC3, the quality of the models was evaluated by the area under the Receiver Operator Characteristic (ROC) Curve (AUC). The resulting models were compared in relation to three groups of fallers: fallers from 0 to 6 months, fallers from 6 to 12 months, and fallers from 12 to 24 months. The significant AUC (i.e., different from a random law) are displayed in the figure where #p < 0.05, ##p < 0.01, or ###p < 0001. Note. Significant difference between models is reported: *p < 0.05, **p < 0.01 ***p < 0.001.

