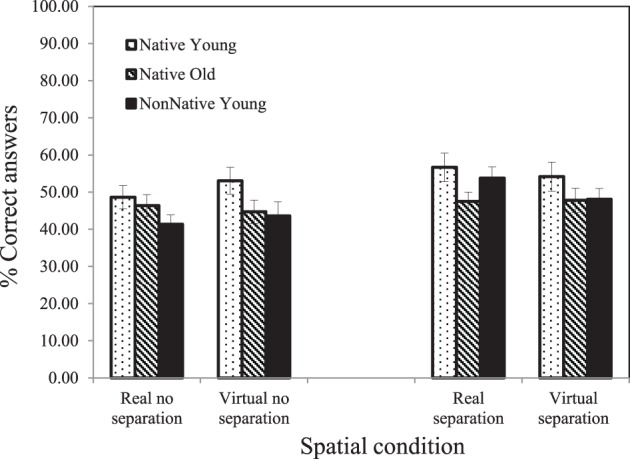
Figure 6.

Average percentage of correctly answered questions calculated under each of the four spatial conditions for each of the three groups. Error bars are shown.

Average percentage of correctly answered questions calculated under each of the four spatial conditions for each of the three groups. Error bars are shown.