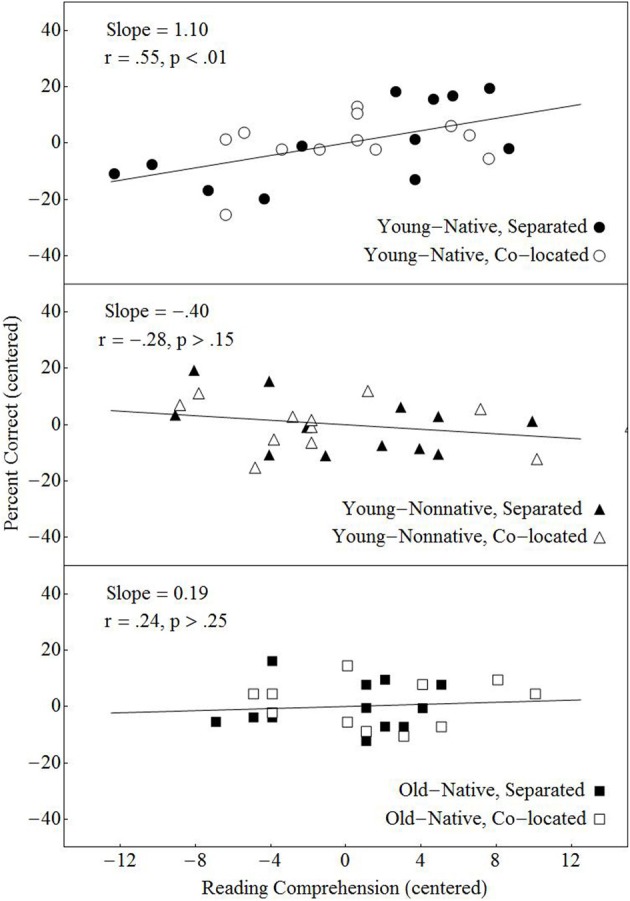
Figure 8.

Percentage of correctly answered dialog questions plotted against the individual performance on the Nelson-Denny reading comprehension test after the contribution of vocabulary to performance had been removed. Both the adjusted number of questions answered and the Nelson Denny scores are centered within each group. A least squares regressions line is presented for each of the three groups.
