Figure 1.
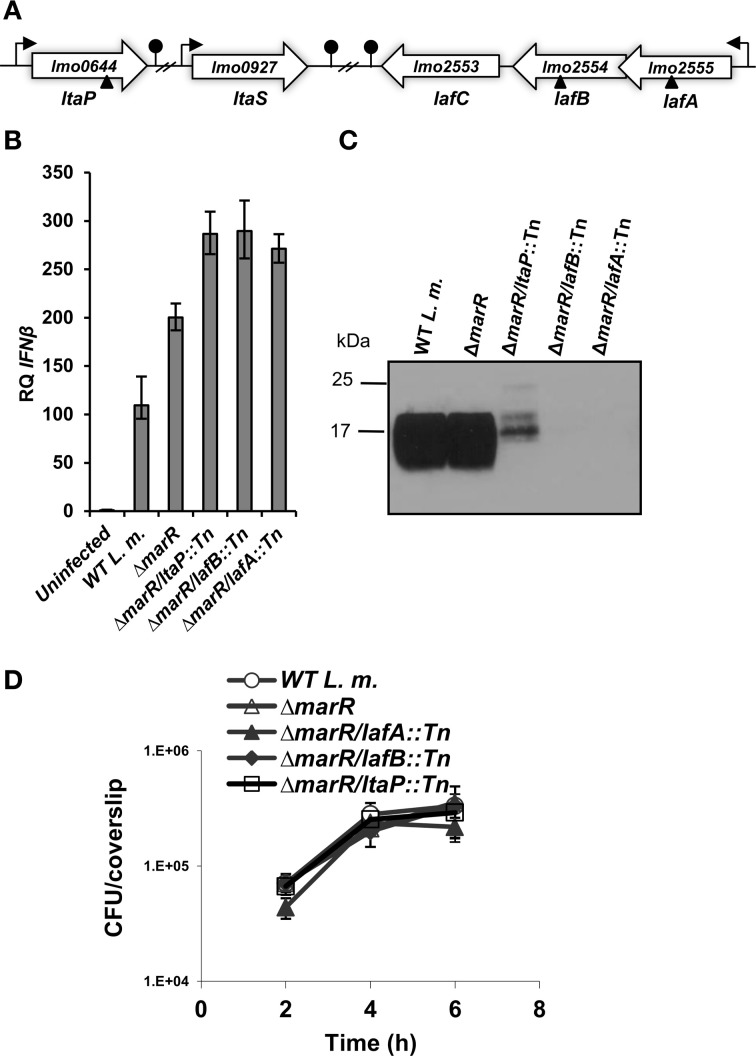
L. monocytogenes LTA mutants trigger enhanced IFN-β response. (A) Schematic representation of the LTA biosynthesis genes in the L. monocytogenes 10403S genome. Transposon insertion sites are depicted by triangles. (B) RT-qPCR analysis of IFN-β transcription levels in BMD macrophage cells infected with WT L. monocytogenes, ΔmarR, and LTA transposon mutants in the ΔmarR background (ΔmarR/ltaP::Tn, ΔmarR/lafB::Tn, and ΔmarR/lafA::Tn) at 6 h.p.i. Transcription levels are presented as relative quantity (RQ), relative to levels in uninfected cells. The data represent three biological repeats (N = 3). Error bars indicate 95% confidence interval (as described in Materials and Methods). (C) Western blot analysis of cell wall-associated LTA in WT, ΔmarR and ΔmarR/ltaP::Tn, ΔmarR/lafB::Tn and ΔmarR/lafA::Tn transposon mutants grown in BHI medium at 37°C using polyglycerolphosphate-specific LTA antibody (Clone 55, Hycult biotechnology). Twenty microgram of total protein were loaded onto SDS-PAGE 15% gel, as described in the Materials and Methods. (D) Intracellular growth curves of WT L. monocytogenes, ΔmarR, and the LTA transposon mutants, in BMD macrophage cells. Representative growth curves are shown, one of three biological repeats (N = 3). Error bars represent the standard deviation of a triplicate.

