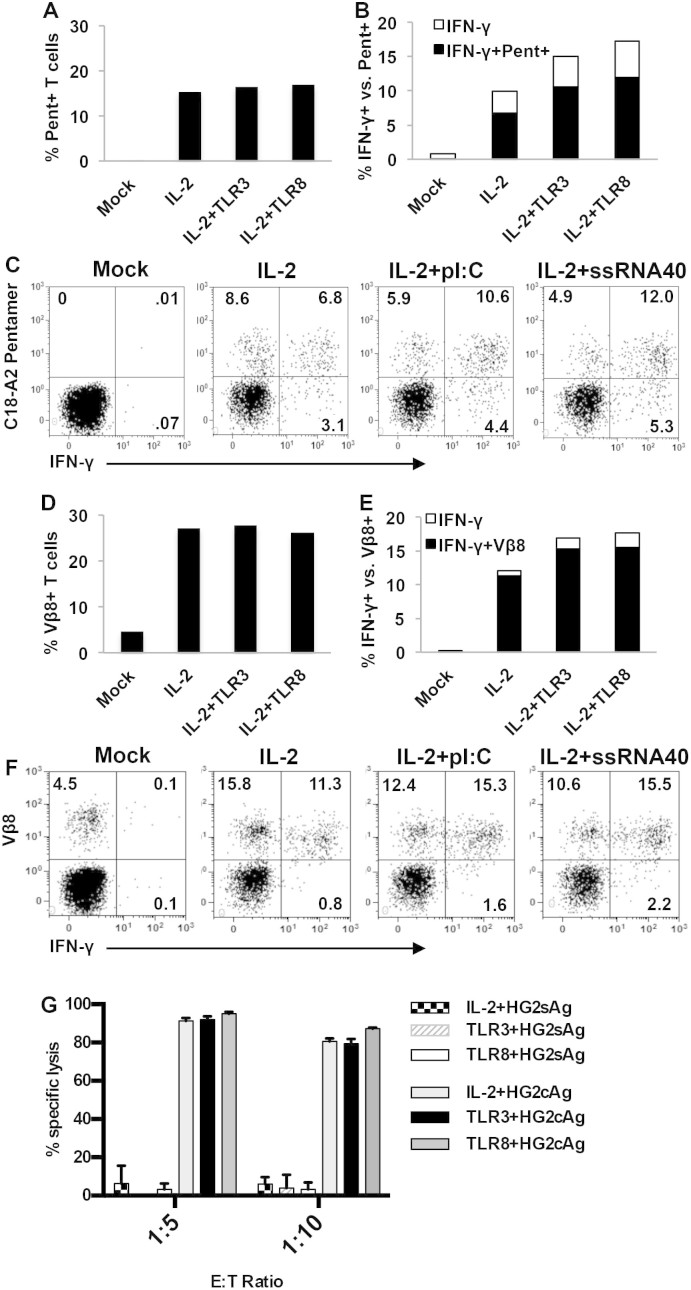
Figure 6. IFN-γ production and cytotoxic function of TCR+ T cells.
(A) Frequency of HLA-pentamer+ CD8+ T cells following transduction of T cells activated in the presence of IL-2 alone or IL-2 + polyI:C or ssRNA40. Mock cells are untransduced T cells as negative control (B) Frequency of IFN-γ+ T cells in each transduction condition. Bars show total frequency of IFN-γ+ CD8+ T cells. Black portion constitutes the IFN-γ+/pentamer+ T cell fraction. (C) Dot plots showing pentamer vs. IFN-γ staining on CD8+ T cells transduced under different conditions. (D) Frequency of TCR beta+ CD8+ T cells following transduction of T cells activated in the presence of IL-2 alone or IL-2 + polyI:C or ssRNA40. (E) Frequency of IFN-γ+ T cells in each transduction condition. Bars show total frequency of IFN-γ+ CD8+ T cells. (F) Dot plots showing TCR beta vs. IFN-γ staining on CD8+ T cells transduced under different conditions. (G) Specific lysis of hepatocyte cell lines expressing HBV antigens with sorted HBV core18–27 TCR, V beta+ CD8+ transduced T cells cultured under different conditions. HG2sAg expresses irrelevant antigen as negative control and HG2cAg expresses HBV core antigen.

