
Fig. 1.
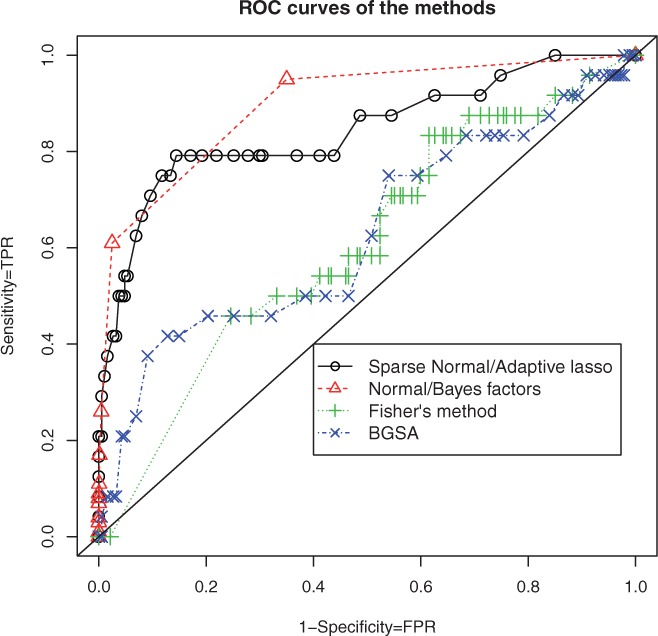
ROC curves of the four methods for different simulated responses. The hyper-parameter combination of the NBF method is  . The hyper-parameter
  for the SNAL method. The simulated response was created in the first case of the second scenario, i.e. the selected pathways were selected by SNAL