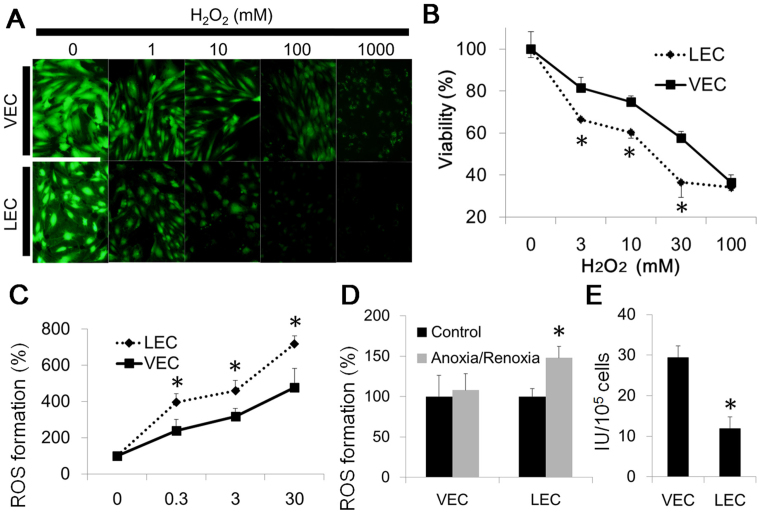
Figure 3. Vulnerability of LEC and VEC to oxidative stress.
(A), (B) Viability assay for oxidative stress induced by H2O2. Representative fluorescence image (A, scale bar, 10 μm) and the intensity of fluorescence (B). Viability of LEC decreased more severely than VEC. (C) Intracellular ROS produced by H2O2 is shown. ROS of LEC increased more severely than VEC. (D) Intracellular ROS accumulation induced by anoxia stress followed by reoxygenation. ROS accumulated in LEC more markedly than VEC. (E) Intracellular SOD activity, which is lower in LEC than VEC. All values represent the mean ± SEM from more than five wells. Significant differences between the means are indicated, *P < 0.05 versus VEC in (B), (C), (E) and versus control in (D). n = 4, in each group.

