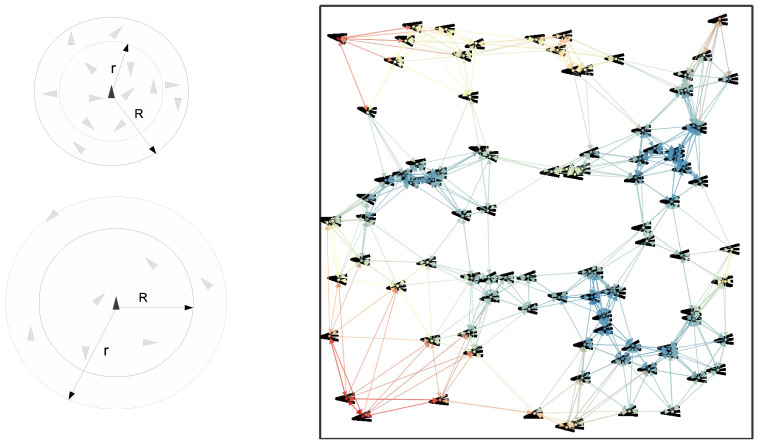
Figure 4.
(A) (Left) Schematics of metric (top) vs. topological (bottom) neighborhood of interactions. R is the radius of the metric neighborhood and r is the radius of the topological one based on the rule of k-nearest neighbors with k = 7. R is constant as it defines a metric zone around the agent while r changes in accordance with the distance between the agent and its k-th (here 7-th) nearest neighbor. (B) (Right) Snapshot of a swarm of N = 100 of agents whose directions are represented by black arrowheads. The N agents interact topologically with their k = 7 nearest neighbors and the associated signaling network is shown. Nodes and edges are colored according to the topological distance (increasing distance from blue to red).

