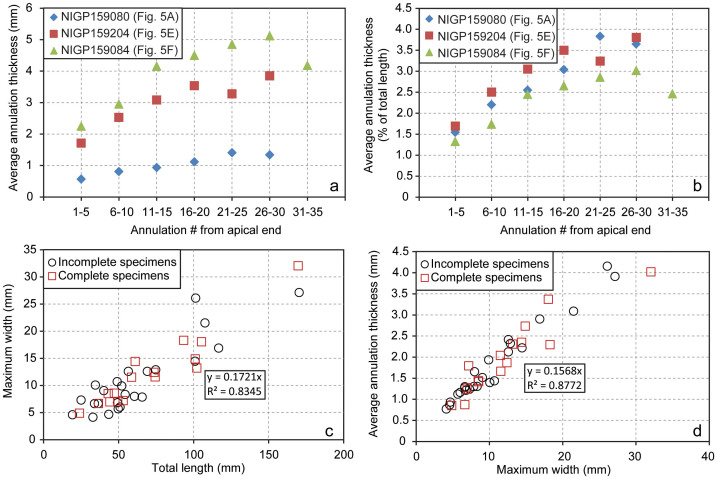
Figure 8. Measurements of Wutubus annularis.
(a–b) Plots showing abapical thickening of annulae in three completely preserved specimens of different size. Annulation thickness is averaged for every five annulae. When annulation thickness is normalized against total length of specimens (b), the trend of abapical thickening is more similar among the three specimens, indicating inflational growth. (c–d) Correlation among total length, maximum width, and average annulation thickness (averaged for each specimen). Regression and correlation statistics are based on pooled measurements of both complete and incomplete specimens.

