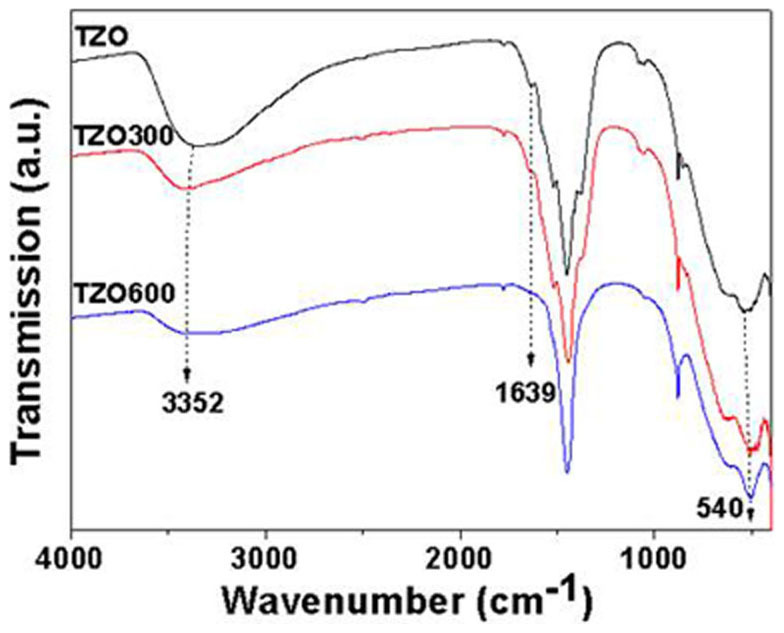
Figure 7. FTIR spectra of as-synthesized TZO, TZO300 and TZO600 samples in the wavenumber range of 4000–400 cm−1.

The broad absorptions at about 3352 and 1639 cm−1 are assigned to the hydroxyl groups of chemisorbed and/or physisorbed H2O molecules on the samples. A strong absorption band near 540 cm−1 reveals the vibration properties of ZnO NRs. Other unsigned peaks are attributed to remnant organic species in the samples.
