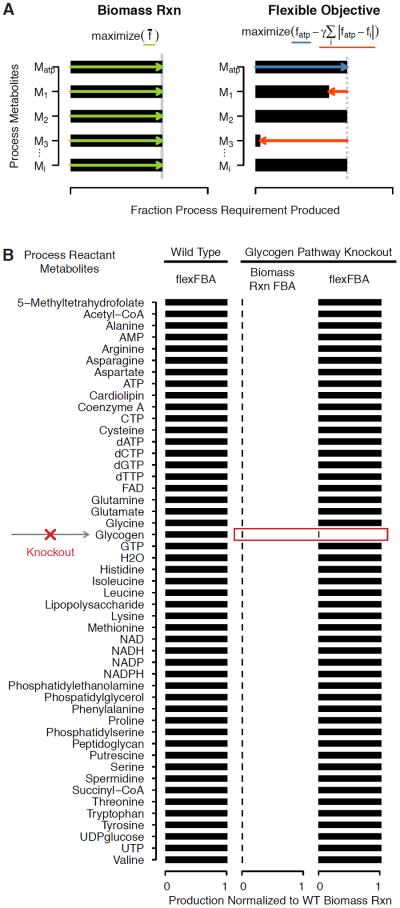
Figure 1.
Flexible FBA objective and Time Step Linked Simulation diagrams. (a) Diagram of biomass reaction flux maximization compared to application of flexible FBA to a small example system with key metabolite Matp corresponding to ATP and other biomass metabolites generically denoted Mi. The biomass reaction flux maximization objective optimizes for the production of all metabolites necessarily in exact proportion (green). The flexible FBA objective increases ATP production (blue) with a penalty for any other process reactant which is produced less than proportionally (red). (b) FlexFBA objective demonstration showing biomass metabolite production for the wild type metabolic network, and for a glycogen pathway knockout compared to biomass reaction flux maximization objective for that knockout.

