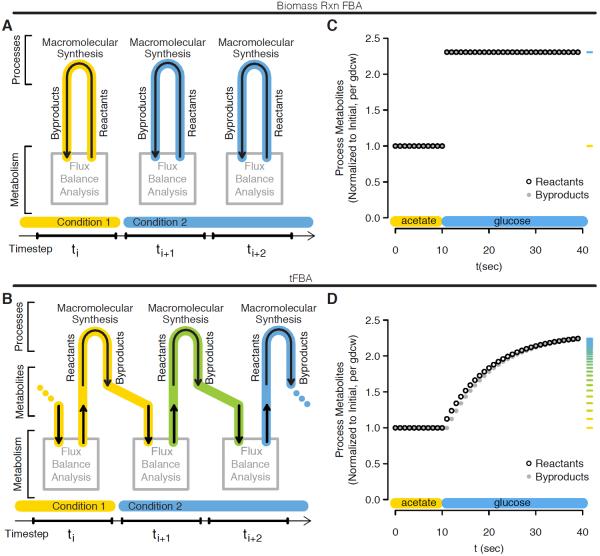
Figure 3.
Biomass reaction FBA and tFBA time step relationship schematics and example media transition simulations. (a) Biomass reaction FBA diagram of relationship between metabolism and biomass process within and between time steps, with influence from simulation conditions represented as colored highlight. (b) and corresponding tFBA diagram. (c) Biomass reaction FBA simulation of acetate to glucose media transition at t = 10 sec showing normalized production of biomass reactants (black open) and return of biomass byproducts (closed grey). Marginal ticks for process reactant production values are colored according to a scale of yellow to blue with the end points set as steady states of acetate and glucose growth respectively. (d) and corresponding tFBA simulation of acetate to glucose media transition.

