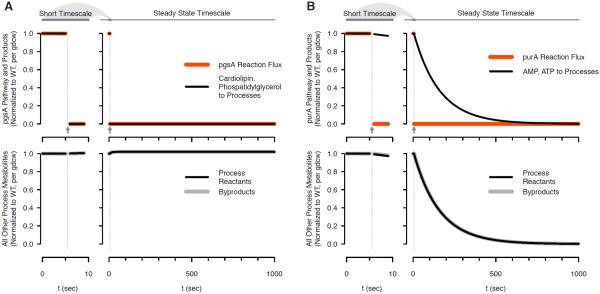
Figure 4.

Flex and tFBA simulation with knockouts. Immediately after perturbation (left panels) at t > 5 sec indicated by arrows, and in the steady state time limit (right panels). (a) Acidic phospholipid pathway knockout of gene pgsA. (b) Purine pathway knockout of gene purA.
