Figure 6.
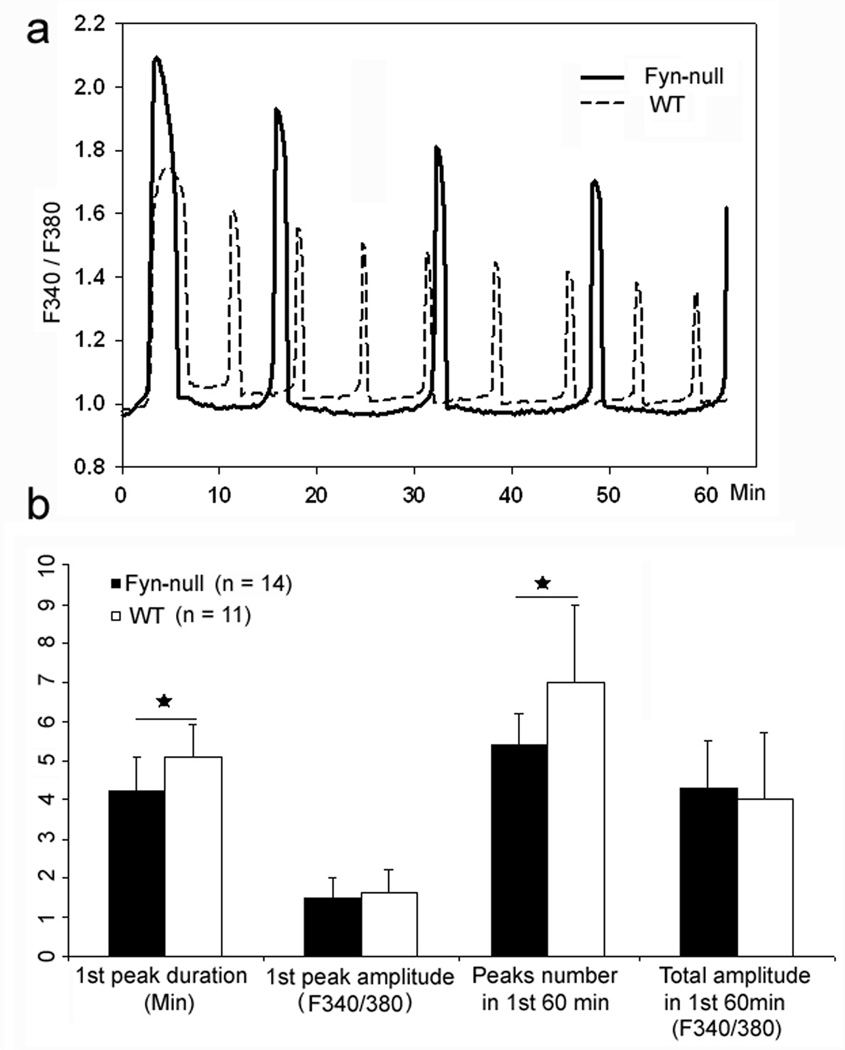
Calcium oscillatory patterns typical of fertilised Fyn-null oocytes. Cumulus- and zona pellucida-free oocytes from nine Fyn-null and five wild-type (WT) female mice were loaded with fura-2, bound to polylysine-coated coverslips and fertilised with WT spermatozoa in vitro so that fertilisation-induced calcium oscillations could be recorded. (a) The typical pattern of calcium oscillations following fertilisation of WT (dashed line) and Fyn-null (solid line) oocytes. (b) The average duration and amplitude of the first calcium oscillation, as well as the total peak number during the first hour after insemination. The total integrated calcium input signal during the first hour after insemination is presented on the far right. The y-axis values show the mean ± s.d.; n values represent the number of recordings analysed from each group. Groups that differ significantly (P < 0.05) are marked with asterisks.

