Figure 5.
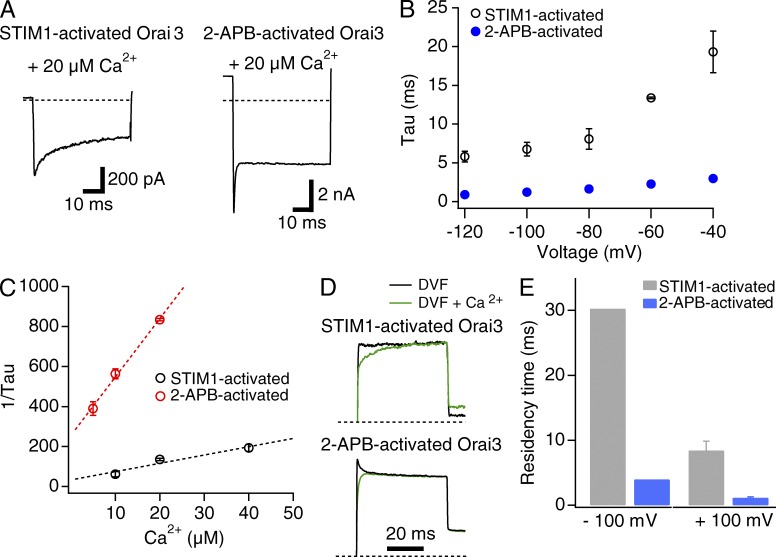
The kinetics of channel blockade is significantly faster in 2-APB–gated channels compared to STIM1-gated channels. (A) STIM1- and 2-APB–activated Na+ currents in the presence of 20 µM Ca2+. Currents were elicited using a step pulse to −100 mV as described in Fig. 4. (B) Time constants of Ca2+ blockade of STIM1- and 2-APB–activated Orai3 currents as a function of voltage. Cells were stepped from the holding potential (+50 mV for STIM1-gated channels and −30 mV for 2-APB–gated channels) to the indicated test pulse. (C) Plot of the reciprocal of the time constant obtained at −100 mV against the blocking Ca2+ concentration. The slope and y-axis intercepts of the straight-line fits to the data are 4 × 10⁶ M−1s−1 and 33 s−1 (STIM1-gated channels) and 3 × 10⁷ M−1s−1 and 246 s−1 (2-APB–gated channels). (D) Relief from Ca2+ block at +100 mV. Ca2+ block was induced at 20 µM Ca2+o through a 200-ms step to −100 mV, and the membrane voltage was stepped to +100 mV to induce relief of blockade. The normalized traces (normalized to the steady-state current at +100 mV) show the recovery from blockade after the step to +100 mV. (E) Summary of the dwell time of Ca2+ occupancy at −100 and +100 mV. Dwell times were calculated as 1/koff. The values at −100 mV were derived from koff estimates from the fit of the mean data shown in C; hence there are no error bars for these values. Data at +100 mV were determined from decay constants in experiments shown in D. Error bars represent SEM.

