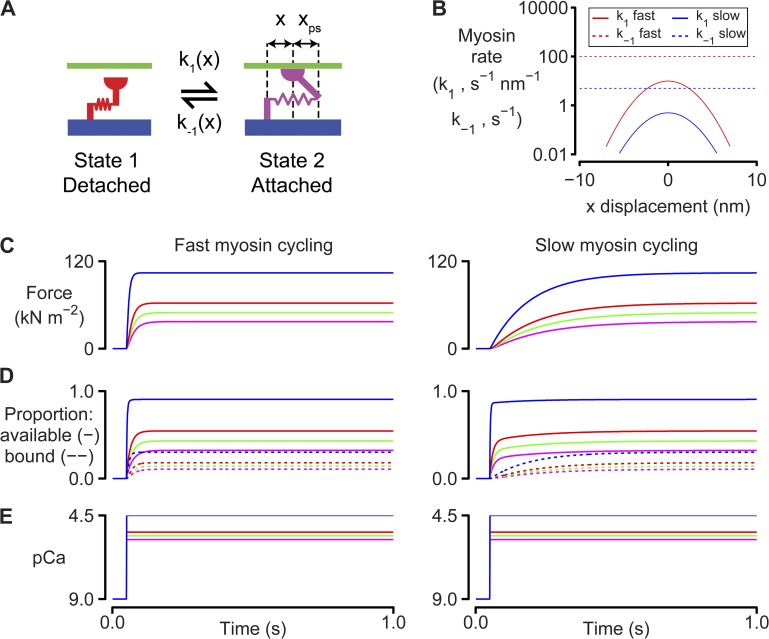
Figure 1.
Myosin and binding site kinetics. (A) Two-state myosin scheme. (B) Rate functions for the simulations shown in C–E. k1(x) is a Gaussian function. k−1(x) is set to a constant value for simplicity. Adding strain dependence to k−1(x) would not change the qualitative features of the force responses because the muscle is held isometric throughout the simulations. Model parameters are listed in full in Table S1. These simulations were performed at full-filament overlap where Noverlap was always equal to N0. (C) Calculated force values for simulations where the Ca2+ concentration is switched from pCa 9.0 to 5.8 (magenta), 5.6 (green), 5.4 (red), or 4.5 (blue) at 0.1 s. The left-hand panel shows predictions for k1 fast and k−1 fast (B). The right-hand panel shows predictions for k1 slow and k−1 slow. (D) As for C, but showing the number of binding sites that are available (solid lines) and the number of sites that are bound (dotted lines). (E) Ca2+ concentrations.

