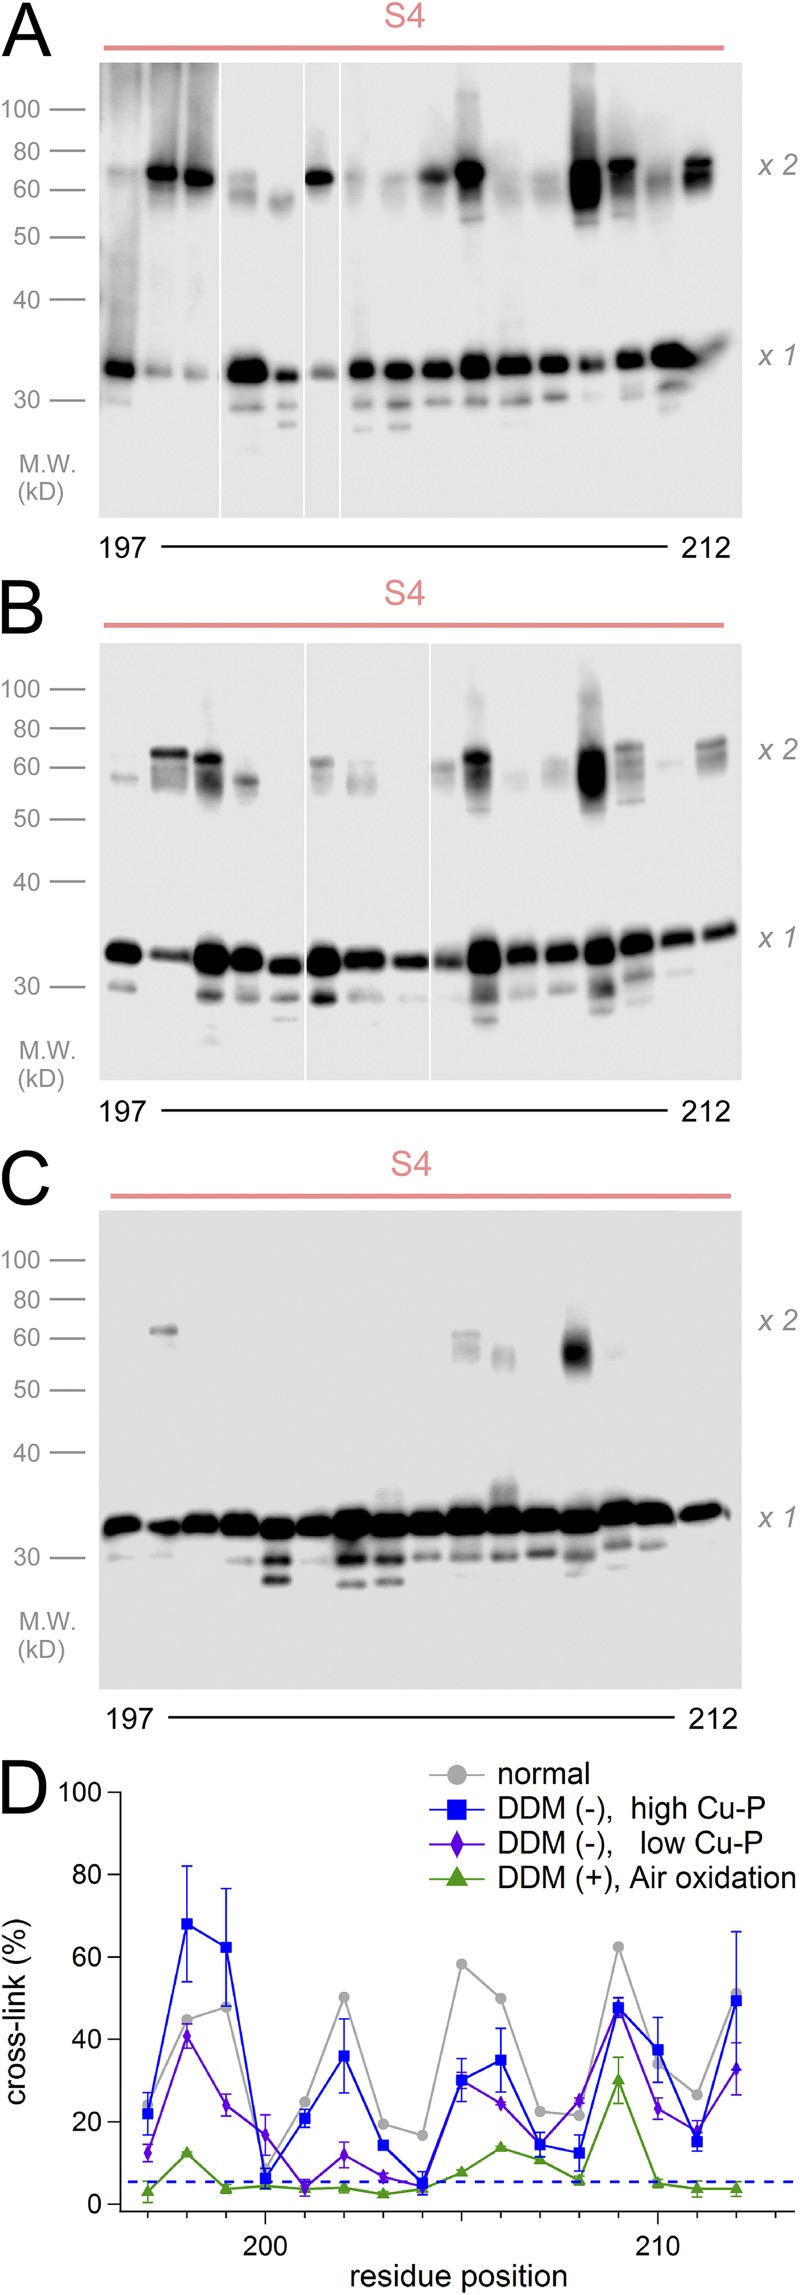
Figure 4.
Cross-linking analysis for S4 in various conditions. (A–C) Representative images of the cross-linking analysis for the S4 segment. Suspensions of cells in the absence of DDM were analyzed (A and B). Cross-links were induced by Cu-P (A), by 100th concentration of Cu-P (B), and by the air oxidation (C). White lines in A and B indicate that intervening lanes have been spliced out. (D) Accumulated data of the cross-linking analysis. The data were plotted as the mean ± SEM (n = 3). The gray line indicates the control data in the normal condition (DDM (+) and Cu-P (+)) from Fig. 3 C. The blue dashed line indicates background signal of the negative control in this analysis.

