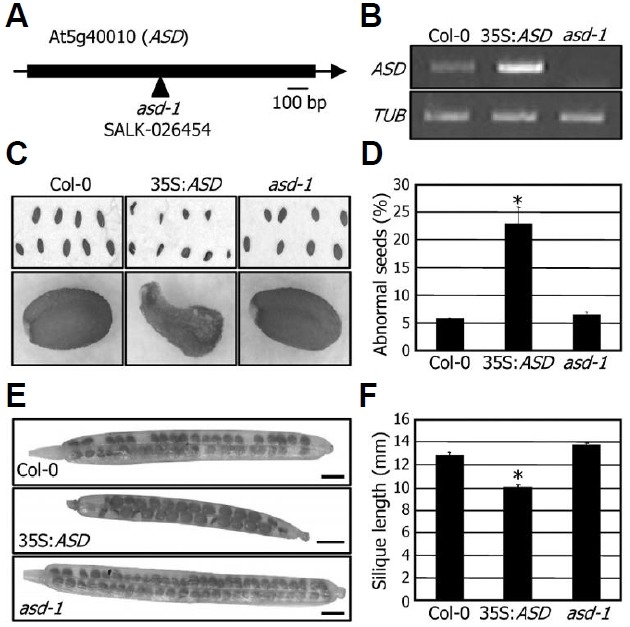
Fig. 3. Seed phenotypes of the 35S:ASD transgenic and asd-1 mutant plants. (A) Mapping of the T-DNA insertion site in the asd-1 mutant. (B) Transcript levels of the ASD gene. Transcript levels were examined by RT-PCR using RNA samples extracted from 2-week-old whole plants grown on MS-agar plates. (C) Seed pheno-types. Mature seeds were photographed. (D) Quantification of per-centages of abnormal seeds. Approximately 200 seeds were used from each counting to calculate percentages of abnormal seeds. Bars represent standard error of the mean (t-test, *P < 0.01). (E) Silique development. Images show representative siliques from plants grown in soil under long days for 50 days after germination. Scale bars = 1 mm. (F) Measurements of silique lengths. Silique lengths were calculated using 50 siliques for each plant group. Bars represent standard error of the mean (t-test, *P < 0.01).

