Fig. 2.
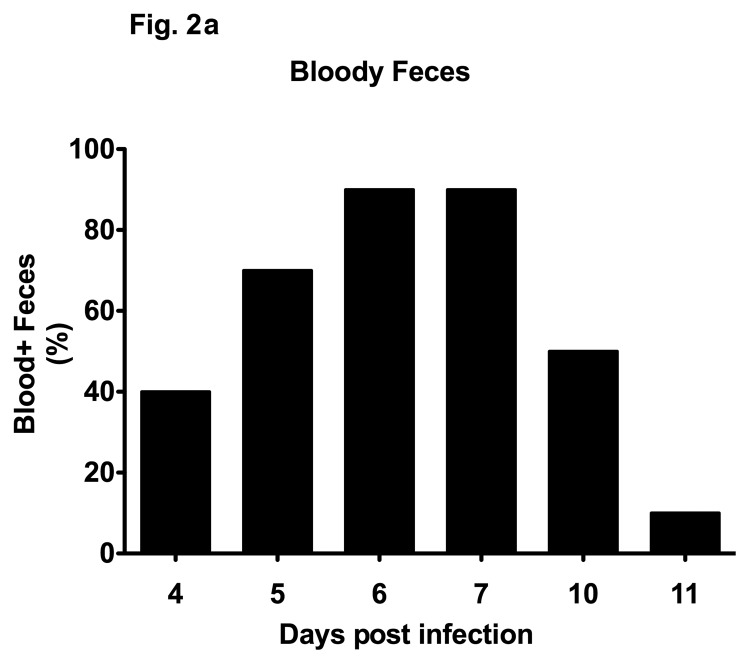
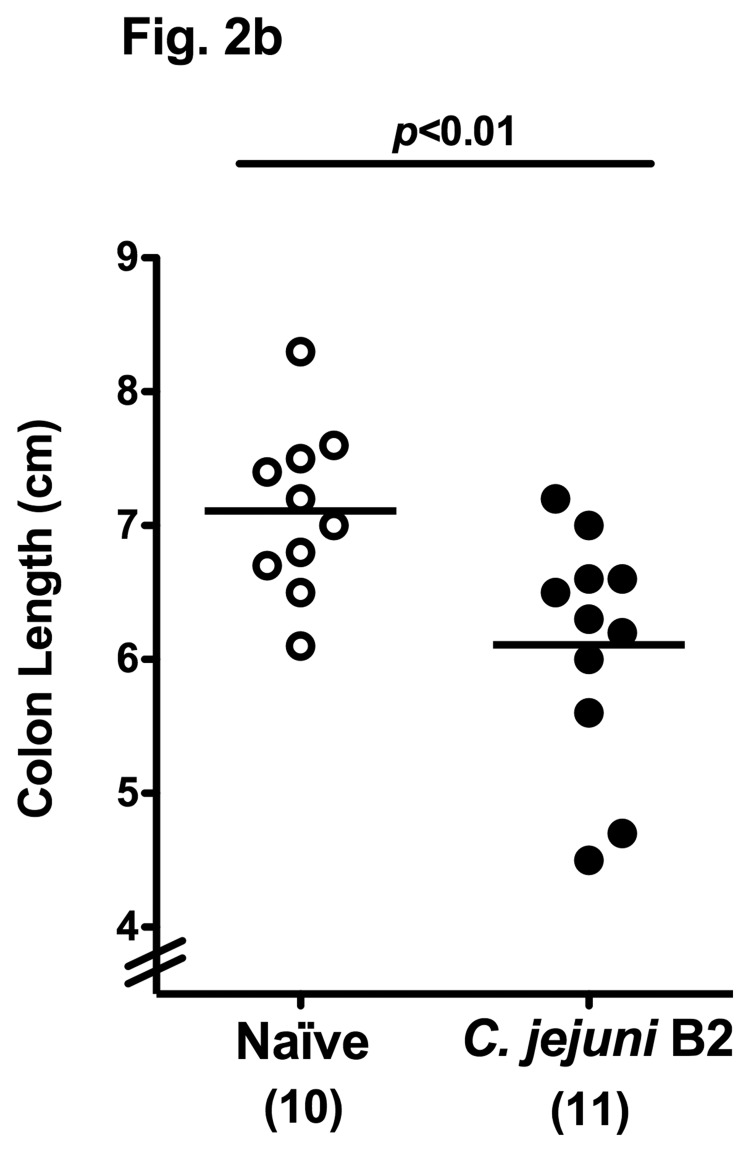
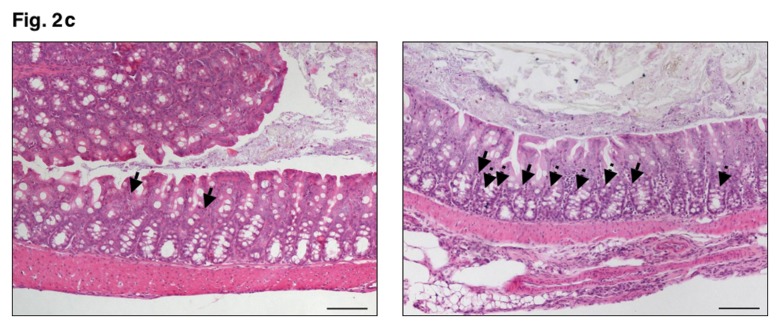
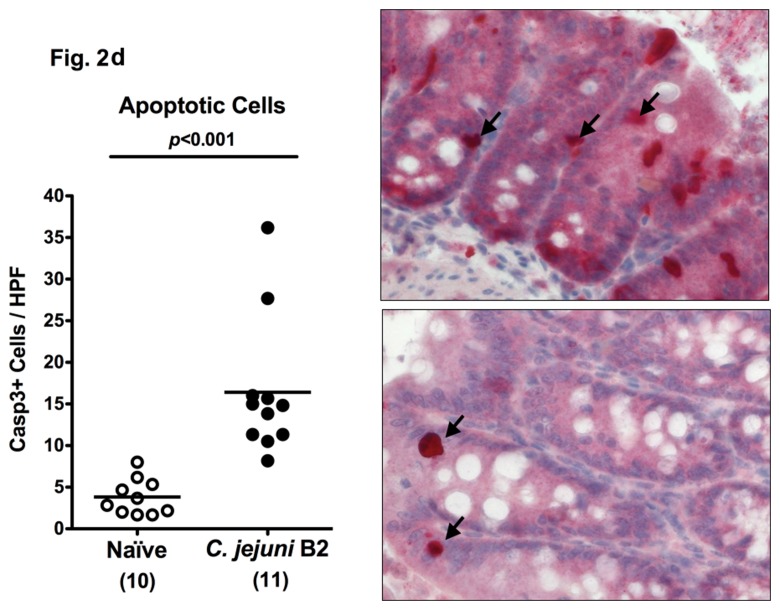
Clinical signs of enterocolitis following C. jejuni infection of infant mice. Infant mice 3 weeks of age were infected with C. jejuni B2 right after weaning (see section Materials and methods). (a) Kinetic analyses of the occurrence of blood in feces samples were performed in C. jejuni B2 infected mice (n = 10). Black bars indicate the relative number of blood positive feces samples (in %). Days post infection are indicated on the X-axis. (b) Colon lengths were determined in C. jejuni B2 infected infant mice at day 6 p.i. (solid circles) and compared to naïve controls (Naïve, open circles). Numbers of animals are given in parentheses. (c) Paraffin sections of colon samples were obtained from C. jejuni B2 infected infant mice at day 6 p.i. and HE-stained (right). Uninfected age-matched mice served as negative controls (left). Solid arrows indicate apoptotic cells and dotted arrows indicate mitotic cells. Representative photomicrographs (magnification ×100; scale bar 100 pm) from three independent experiments are shown. (d) Paraffin sections of colon samples from C. jejuni B2 infected (day 6 p.i.; solid circles) and naïve (naïve, open circles) infant mice were stained with cleaved caspase-3 antibody (see section Materials and methods). The average numbers of apoptotic cells (positive for caspase-3, left panel) from at least six high power fields (HPF, ×400 magnification) per animal were determined microscopically in immunohistochemically stained colon sections. Representative photomicrographs (right panel) show more caspase3+ cells in infected mice (arrows) at day 6 p.i. (upper right) as compared to control mice (lower right). Numbers of animals are given in parentheses. Medians (black bars) and significance levels (P-values) as determined by Student’s t-test are indicated


