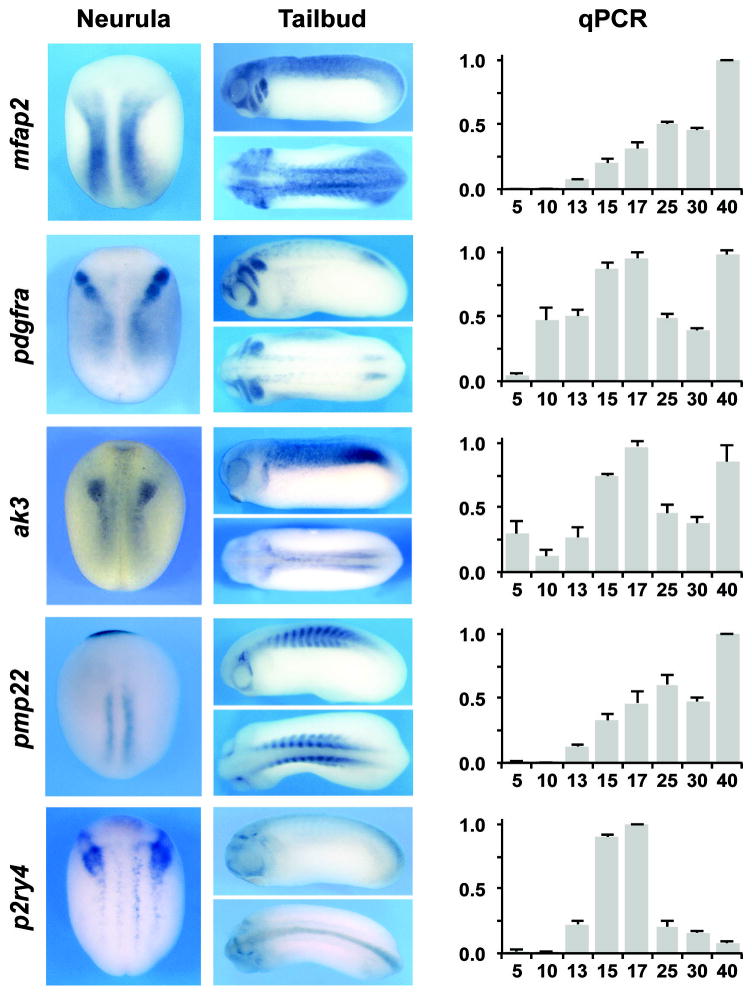
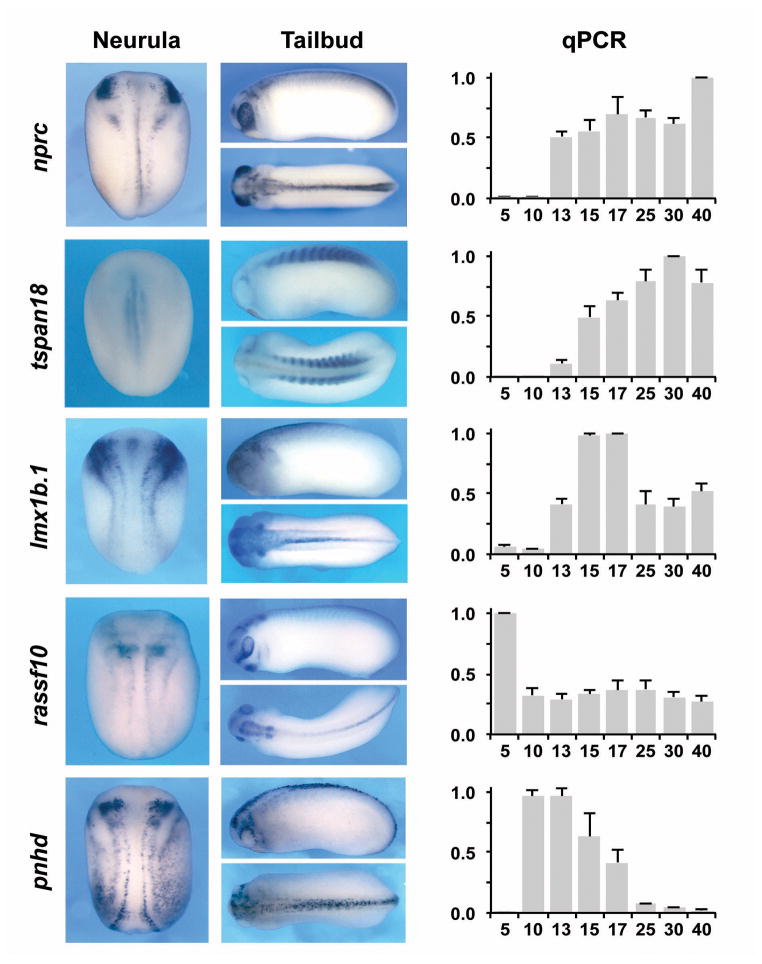
Figure 4. Developmental expression pattern of selected Pax3-Zic1 targets.
The Spatiotemporal expression pattern of 10 Pax3-Zic1 targets was analyzed by qPCR and whole-mount ISH. Expression levels of the target genes were analyzed by qPCR at the indicated stage (right panels). The values were normalized to odc and presented as mean ± s.d. The data are an average of at least three sets of embryos. For ISH embryos were analyzed at the neurula (left panels; dorsal view, anterior to top) and tailbud (middle panels; lateral and dorsal views, anterior to the left) stages.


