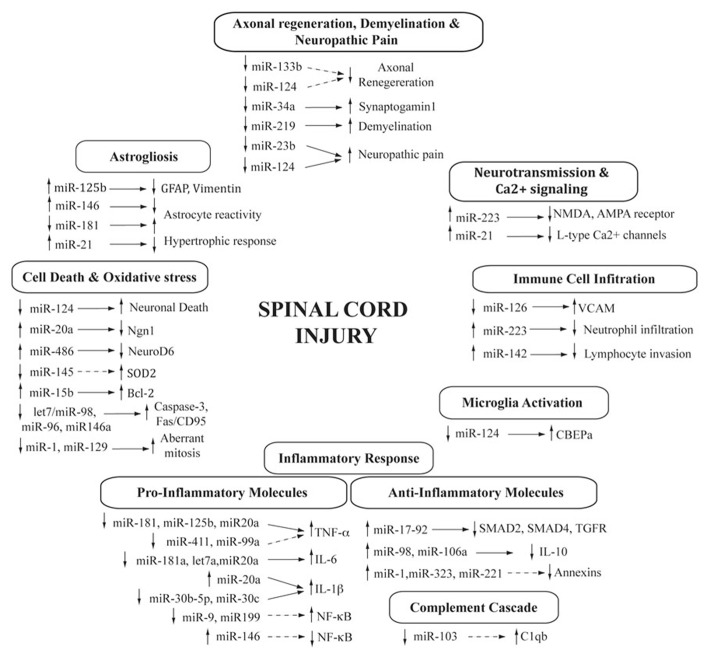
FIGURE 1.
MicroRNAs in the spinal cord injury pathophysiology. Diagram showing the cascade of processes triggered after SCI and the contribution of differentially expressed microRNAs. Changes in microRNA expression is indicated either as increased (up arrow) or decreased (down arrow) after SCI. Target genes are also shown (confirmed, direct regulation are indicated with a solid arrow, whereas those indirect or predicted are represented with a dashed arrow).

