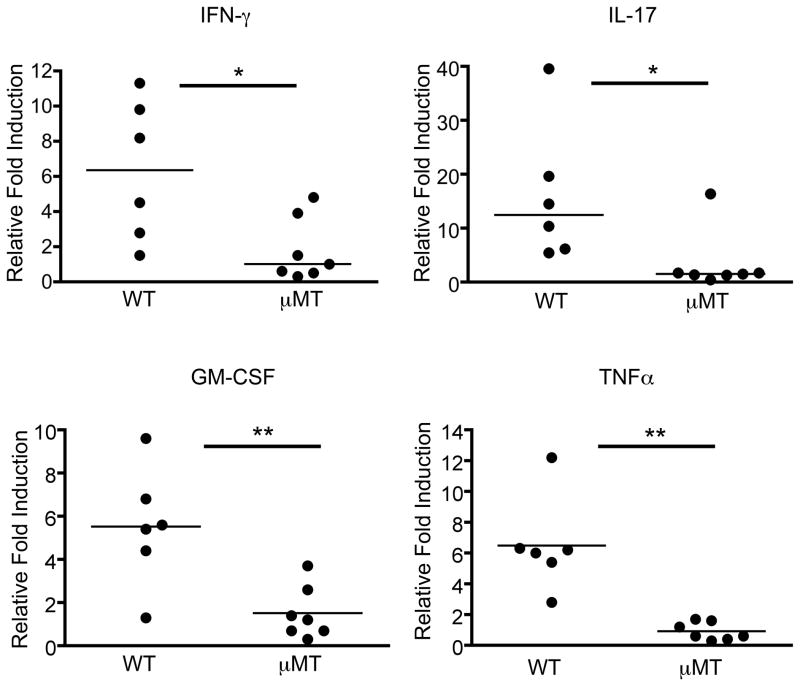
Figure 4. T cell infiltration into the CNS fails to trigger cytokine production in B cell-deficient mice.
Activated Thy1.1+ T cells from MOG-immunized donors were transferred into WT or μMT Thy1.2 recipients. Five days post-transfer, the brains were harvested and cut in half at the sagittal midline. Cells from one half of the brain were analyzed by flow cytometry to determine the number of donor (Thy1.1+) T cells. RNA was harvested for analysis by real-time qPCR from the remaining half of the brains that exhibited comparable numbers of infiltrating donor T cells. The fold induction relative to healthy brain tissue of the indicated cytokines is shown. Each data point represents a single mouse. Samples were obtained in at least 3 independent adoptive transfer experiments. Significant differences between WT and μMT recipients are indicated; *p < 0.05; **p < 0.01, Mann-Whitney non-parametric t test.

