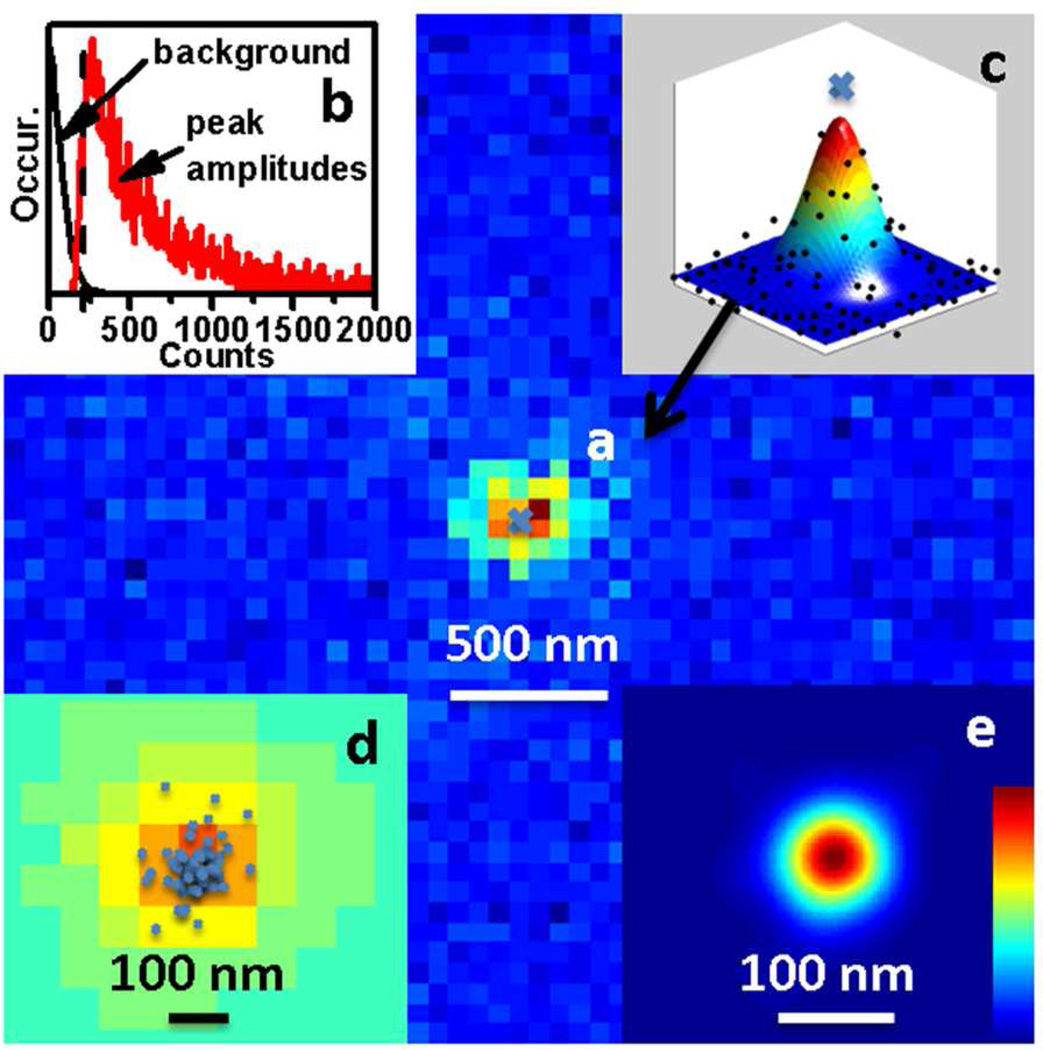
Figure 3.
Data analysis and resolution determination. (a) A fluorescence event is defined on this frame with peak amplitude at least 3 times the background noise. (b) Histograms of background and the amplitudes of the peaks. The dashed line indicates the threshold chosen to distinguish between the background and an adsorption event. (c) The peak is fitted with a 2D Gaussian function for its center position and peak amplitude. (d) The peak centers on all the frames that have events are summarized for this area. (e) Each center is defined as an event and is converted to a virtual Gaussian peak with amplitude = 1 and standard deviation = 30 nm and is converted to a super-resolution image.

