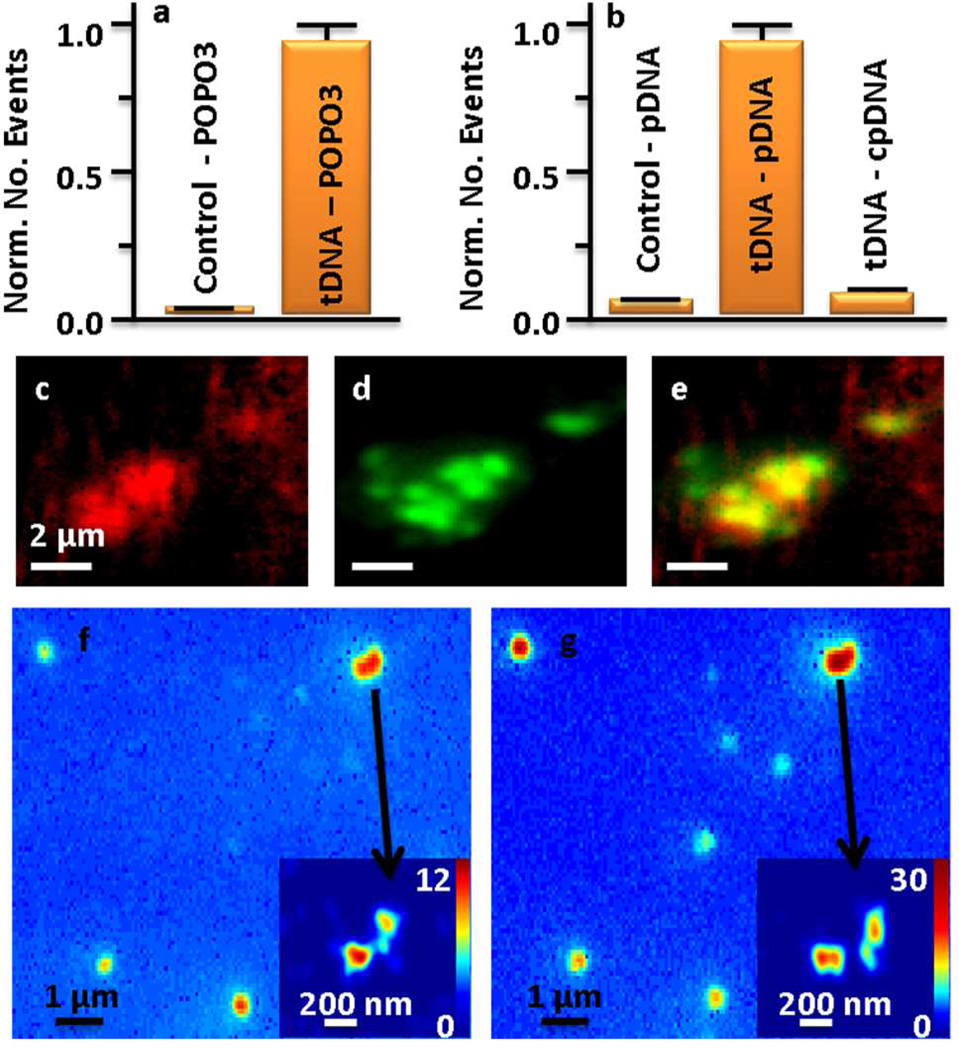
Figure 4.
Demonstration of the specific adsorption of pDNA to tDNA and super-localization of sequence specific tDNA. (a) Histograms of number of events observed for the adsorption of DNA stain dye POPO-3 to substrates before (control) and after immobilization of tDNA. (b) Histograms of number of events observed for the adsorption of pDNA to substrates before (control) and after immobilization of tDNA, and the minimal adsorption of cpDNA to the tDNA substrate. (c) Sum fluorescence image of the adsorption of TOTO-3 and (d) pDNA to tDNA substrate and (e) overlap of the two images. (f) Sum fluorescence image and (inset) super-resolution image of POPO-3 to tDNA substrate. (g) Sum fluorescence image and (inset) super-resolution image of pDNA to tDNA substrate. The numbers indicated in the super-resolution image color scale bar, quantify the number of adsorption events at each location.

