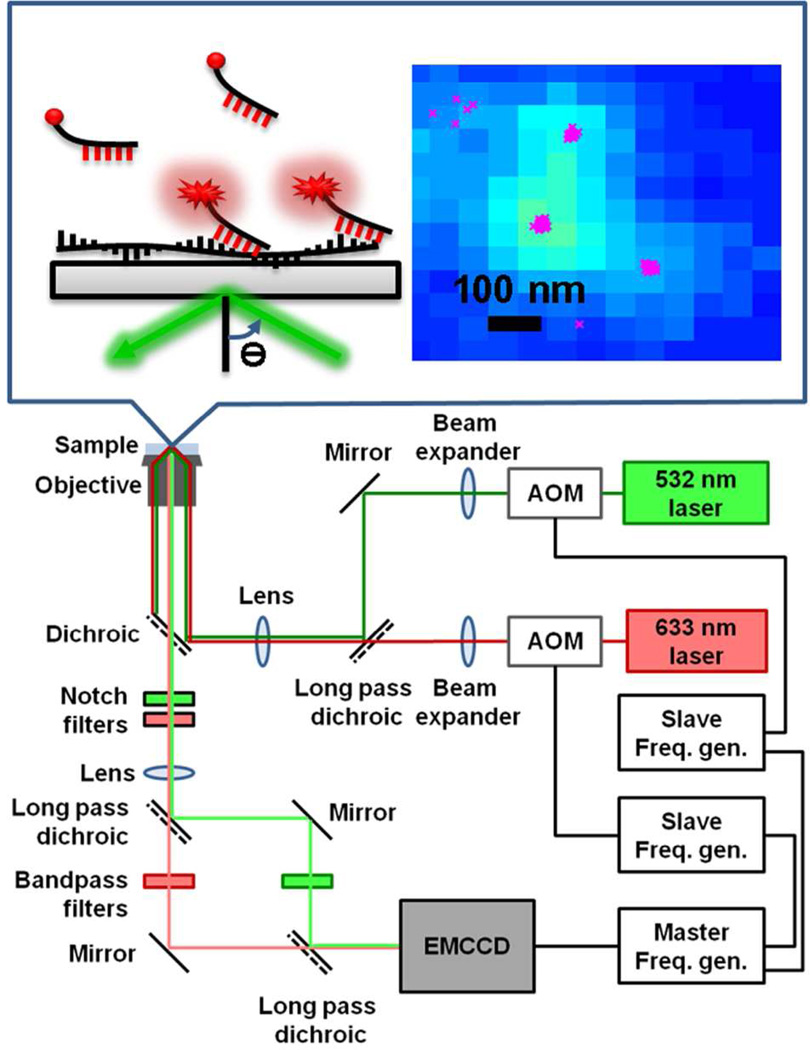
Figure 7.
Scheme of the TIRF microscope, including acousto-optic modulator (AOM) controlled by frequency generators (Freq. gen.) and electron-multiplying charge coupled device (EMCCD) detector. The top scheme shows the experimental geometry and a cumulative fluorescence image of 1000 frames with the x-dots representing the fitted centers of individual fluorescence binding events on separated frames.

