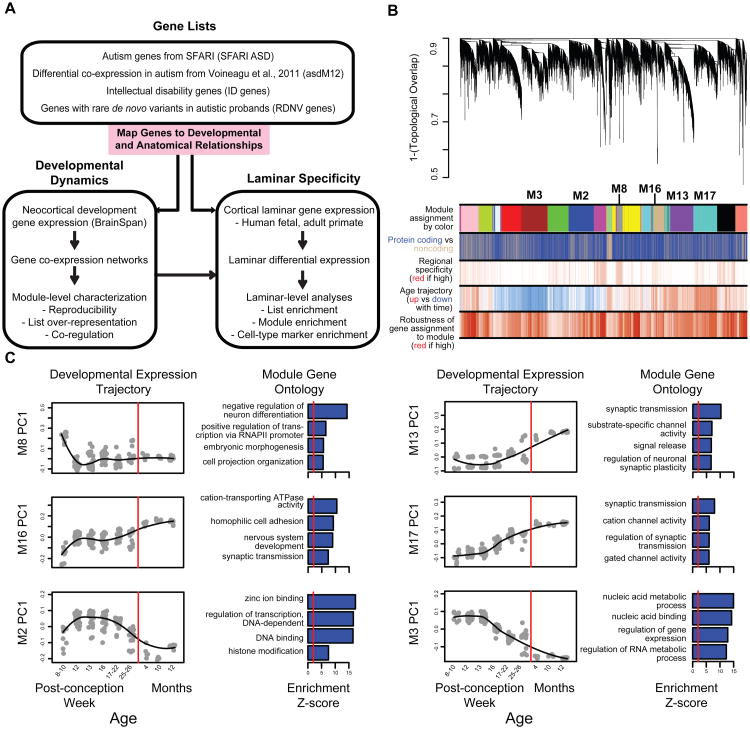
Figure 1. Methodological overview and co-expression network analysis.
(A) Flowchart of the overall approach.
(B) Network analysis dendrogram showing modules based on the co-expression topological overlap of genes throughout development. Color bars below give information on module membership, gene biotype, cortical region specificity, age trajectory, and robustness of module assignment.
(C) Module characterization including GO enrichment and trajectory throughout development. The fit line represents locally weighted scatterplot smoothing (Extended Experimental Methods). GO enrichments are adjusted for multiple comparisons (FDR < 0.01), and reported Z-scores represent relative enrichment, with the red line at Z = 2. See also Table S1 and Figure S1.

