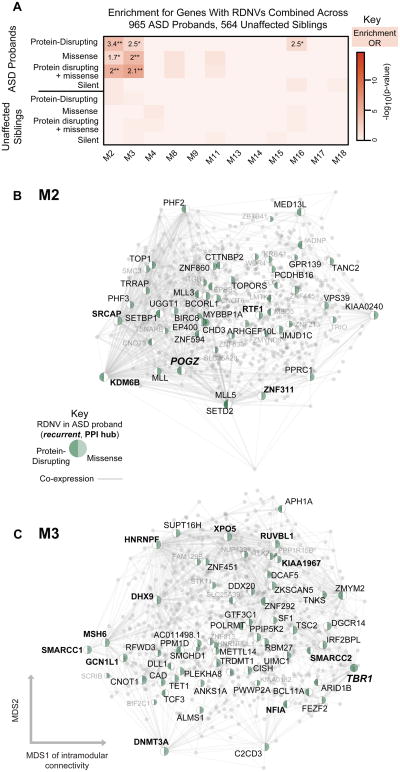
Figure 3. Enrichment of genes affected by RDNVs in developmental networks.
(A) Module-level enrichment for multiple categories of RDNV in ASD affected probands and unaffected siblings combined across four studies. All enrichment values for over represented lists with p < 0.05, OR > 1 are shown to demonstrate enrichment trends (*p < 0.05, **validated in replication set) marked. M2 and M3 are strongly enriched for protein disrupting and missense RDNV affected genes in probands. Enrichment for genes affected by silent RDNVs in probands and RDNV gene sets affected in siblings represent control gene sets and do not show enrichment.
(B) and C) show network plots for M2 and M3, with all genes plotted and all genes carrying RDNVs displayed.
Network plots show all genes in the module with protein disrupting or missense RDNV-affected genes highlighted. Those with high intramodular connectivity (kME > 0.75) are labeled in black, with the rest in grey. The top 1000 connections are shown, and genes are plotted according to the multidimensional scaling (MDS) of co-expression as in Figure 2. See also Figure S2-3 and Table S2.

