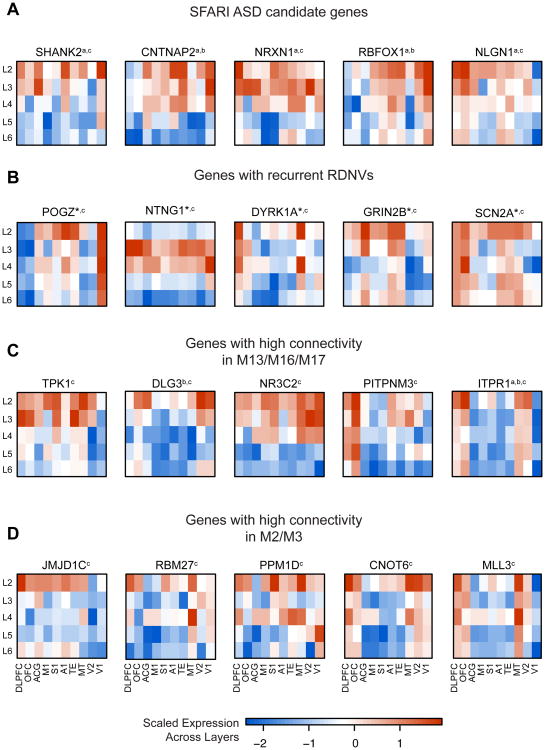
Figure 6. Laminar patterns for genes implicated in ASD.
(A) SFARI candidate genes for ASD.
(C) Genes with strong recurrent RDNV evidence across studies. Genes not displayed include TBR1 (lower layer enriched), CHD8 (no layer enrichment detected), CUL3 (no layer enrichment detected), and KATNAL2 (not detected in these data).
(B) Genes with high connectivity in M13, M16, and M17.
(C) RDNV genes with high connectivity in M2 and M3.
a indicates membership in SFARI ASD, b indicates membership in asdM12, c indicates the gene is affected by a RDNV, *indicates recurrent RDNVs
Color bar values represent scaled expression (standard deviation of the mean-centered expression value across layers). All genes shown have t > 2 for enrichment in an upper layer (L2 or L3) over background, and t < 2 for lower layers (L5 or L6). Regions: dorsolateral prefrontal (DLPFC), orbitofrontal (OFC), anterior central gyrus (ACG), primary motor (M1), primary somatosensory (S1), primary auditory (A1), higher-order visual area TE (TE), higher-order visual area MT/5 (MT), secondary visual cortex (V2), primary visual cortex (V1).

