
Fig. 1.
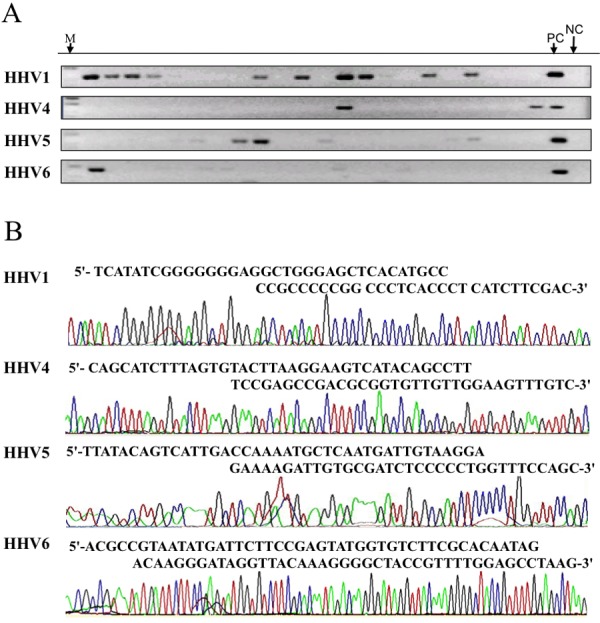
Analysis of viral DNAs by PCR and DNA sequencing. A: Agarose gel electrophoresis. All 153 samples were subjected to nested PCR for 4 viruses using primer sets listed in Table 1 and analyzed on 2% agarose gel. Electrophoresis of representative PCR products after the 2nd PCR is shown. PC (positive control) and NC (negative control) indicate reactions with control virus fragments and without template, respectively. M indicates the size marker. B: Sequence profiles of PCR products. Amplified samples corresponding to the expected length were subjected to sequencing. Representative results harboring virus sequences are shown with the nucleotide sequence determined.