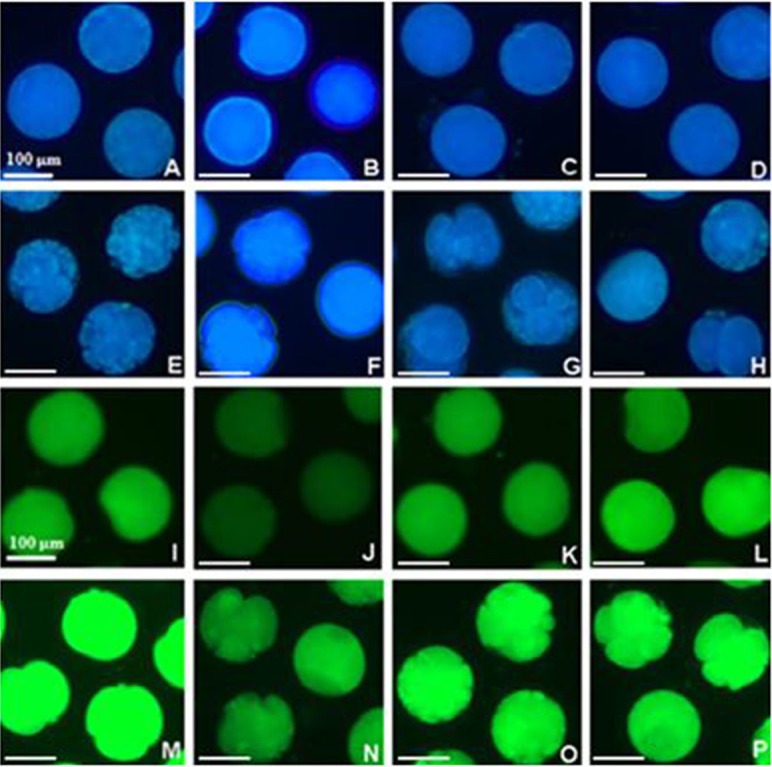
Fig. 3.

Photographic images of in vitro matured oocytes (A–D, I–L) and day 2 parthenotes (E–H, M–P) are arranged according to concentration (0, 1, 5 and 10 μM) of 7,8-dihydroxyflavone in order from left- to right-hand side. They were stained with CellTracker Blue (A–H) and carboxy-H2DFFDA (I–P) to evaluate the intracellular GSH and ROS levels, respectively.
