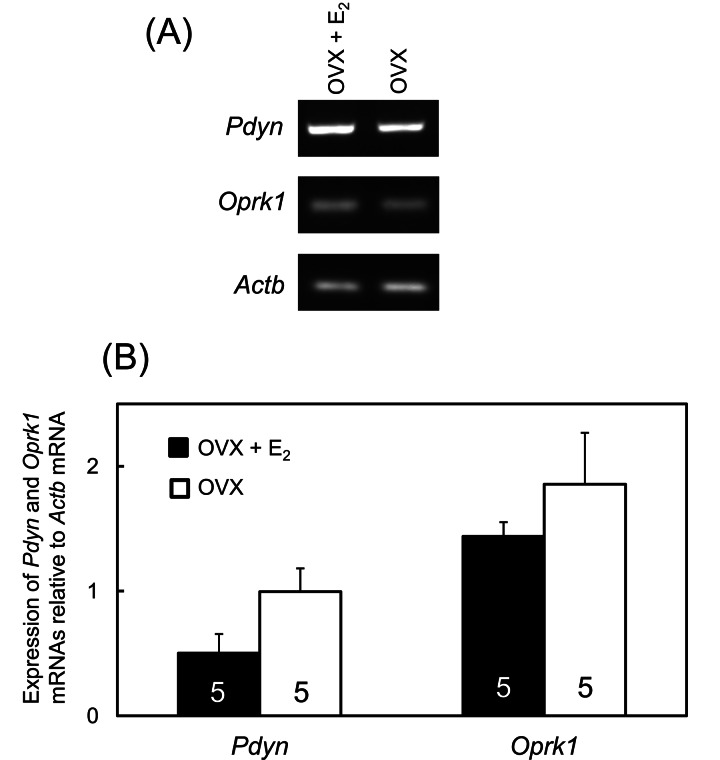
Fig. 4.
Pdyn and Oprk1 mRNA expressions in the ARC-ME region of OVX + low E2 and OVX rats. Representative images of mRNA expressions of Pdyn, Oprk1 and Actb in the ARC-ME region of the OVX + low E2 and OVX groups (A). mRNA levels of Pdyn and Oprk1 were determined semiquantitatively by RT-PCR with the primers shown in Table 1 (B). The analysis was carried out using the ImageJ software of the National Institutes of Health. Values are indicated as the expression relative to Actb, as an internal control. Values are means ± SEM. The numbers in each column represent the numbers of animals used in each group.

