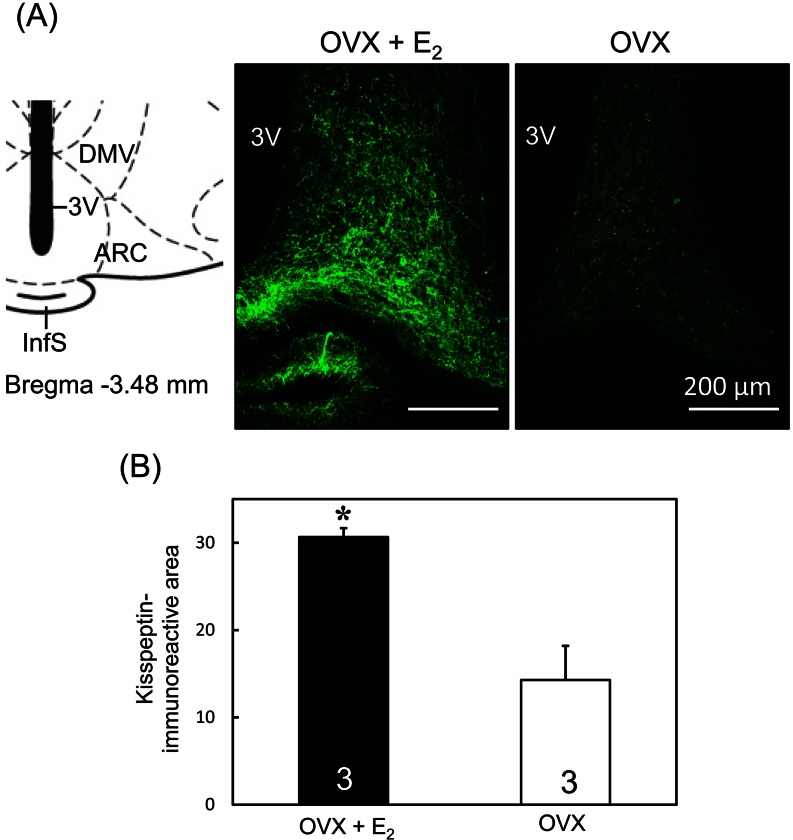
Fig. 5.
Kisspeptin immunoreactivities in the ARC of OVX + low E2 and OVX rats. Schematic illustration and photomicrographs of coronal sections of rat brains including the ARC (A). Schematic drawing of the ARC according to Paxinos and Watson [31] (left). The value in the drawing indicates the distance (mm) to the bregma. Photomicrographs (right) show kisspeptin immunoreactivity (green) in representative animals in the ARC of OVX + low E2 and OVX groups. ARC, arcuate nucleus; DMV, ventral dorsomedial hypothalamic nucleus; InfS, infundibular stem; 3V, third ventricle. Scale bars: 200 µm. Semiquantitative analysis of kisspeptin immunoreactivity in the ARC of OVX + low E2 and OVX rats was determined using the ImageJ software (B). Values are means ± SEM. The numbers in each column represent the numbers of animals used in each group.

