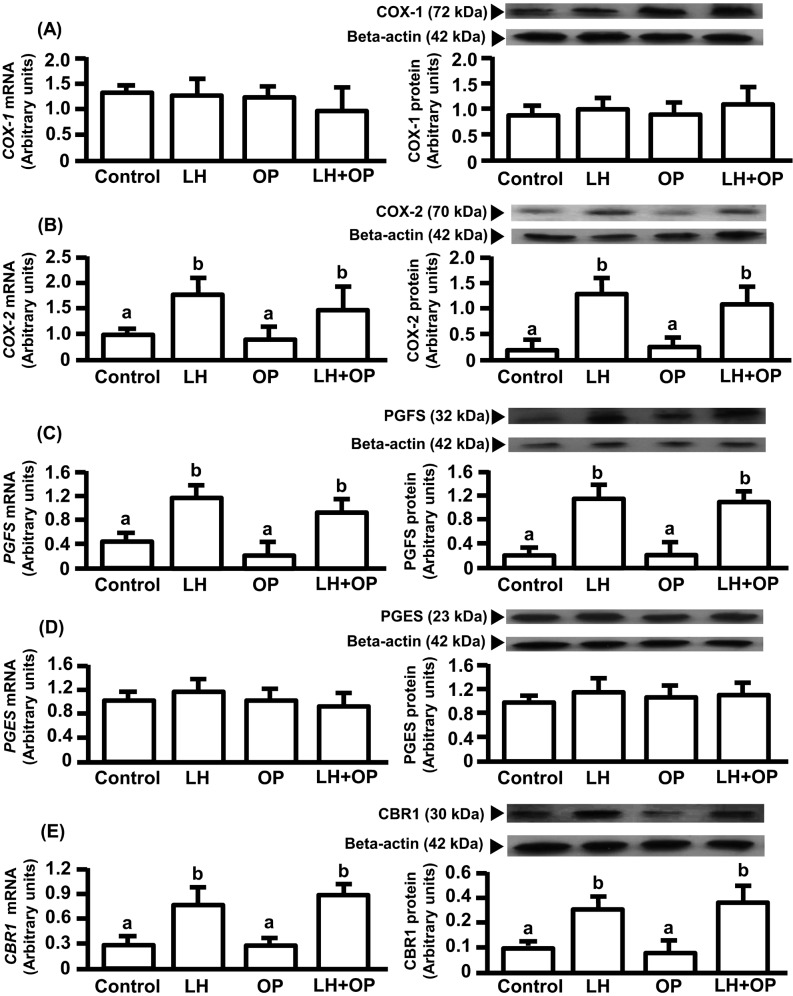
Fig. 1.
Effects of LH and/or OP on COX-1(A), COX-2(B), PGFS(C), PGES(D) and CBR1(E) expressions. The cells were treated with LH (10 ng/ml) alone or in combination with OP (100 μM) for 24 h. mRNA data are the mean ± SEM of five separate experiments each performed in duplicate and are expressed as levels relative to GAPDH levels. Protein data are the mean ± SEM of five experiments each performed with separate cell preparations and are expressed as levels relative to beta-actin levels. Different letters indicate significant differences (P<0.05), as determined by ANOVA followed by a Fisher's PLSD as a multiple comparison test.

