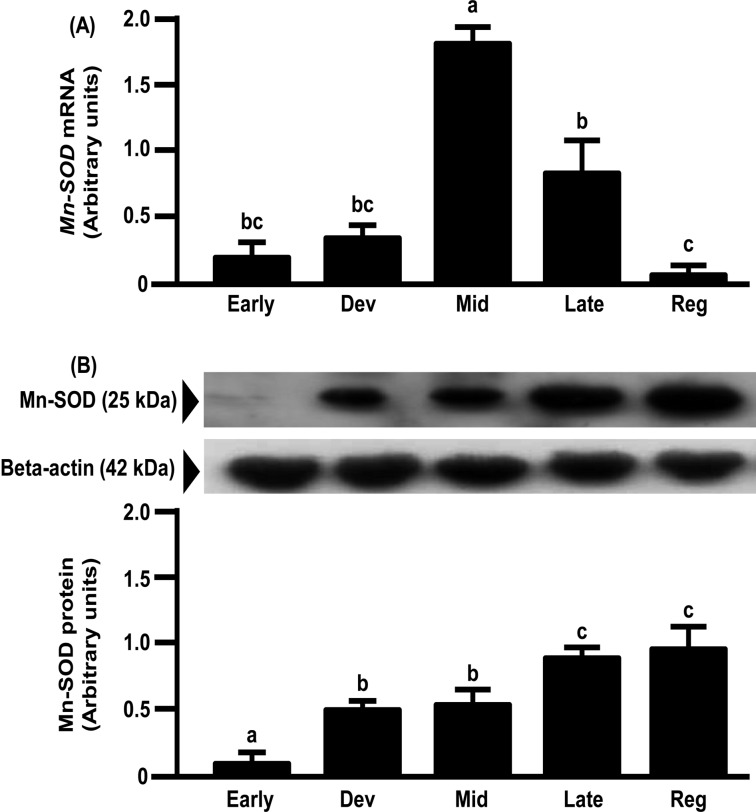
Fig. 5.
Changes in relative amounts of Mn-SOD mRNA (A) and protein (B) in the bovine CL throughout the estrous cycle. mRNA data are the mean ± SEM of four separate experiments each performed in duplicate and are expressed relative to the amount of GAPDH mRNA. Protein data are the mean ± SEM of four experiments each performed with separate cell preparations and are expressed relative to the amount of beta-actin protein. Different letters indicate significant differences (P<0.05), as determined by ANOVA followed by a Fisher PLSD as a multiple comparison test (Early, days 2–3; Developing [Dev], days 5–6; Mid, days 8–12; Late, days 15–17; Regressed luteal stages [Reg], days 19–21).

