Fig. 2.
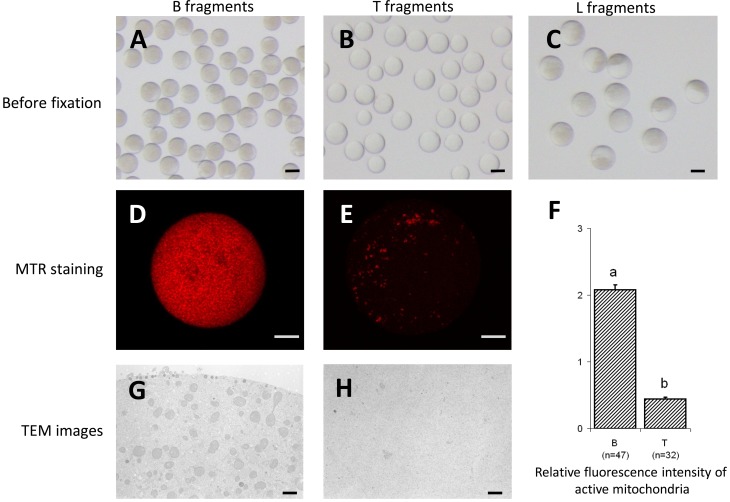
After the 2nd centrifugation at 6,000 × g for 4 sec, three types of fragments – brownish (B), transparent (T) and large (L) – (A, B and C, respectively) were obtained. The distribution after staining with MitoTracker Red CMXRos (MTR) (D, B fragment; E, T fragment) and relative fluorescence intensities of active mitochondria in the B and T fragments are shown (F). Data for relative fluorescence intensity of active mitochondria are given as means ± SEM. a,b A significant difference (P<0.05) in relative fluorescence intensity of active mitochondria was evident between the two groups. Three trials were performed. Total numbers of oocytes measured in each group are given in parentheses. Transmission electron microscopy demonstrated that B fragments contained condensed mitochondria (G), similar to the lower layer of oocytes after the first centrifugation (see Fig. 1I), whereas T fragments had few organelles (H), suggesting that they originated from the middle layer (see Fig. 1H). Scale bars indicate 50 µm, 10 µm and 1 µm for plates A−C, D and F and G and I, respectively.

