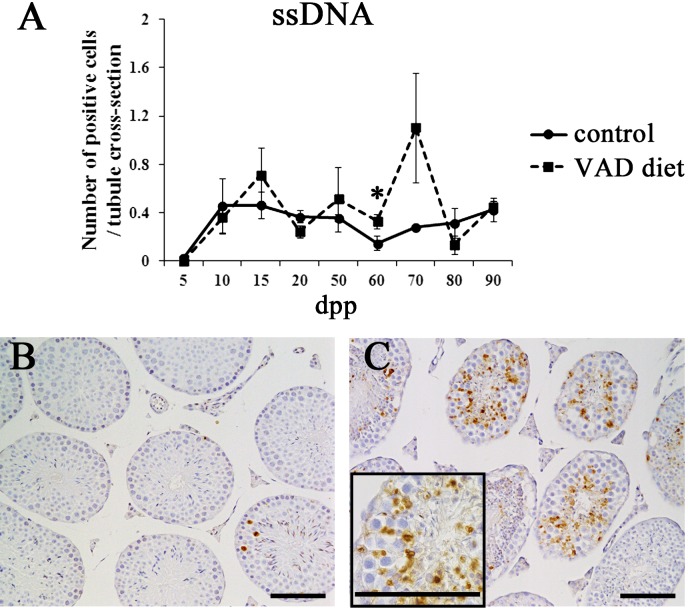
Fig. 4.
Germ cell apoptosis in the testes of mice fed the VAD diet. (A) Total numbers of ssDNA-positive cells in the testes of control mice fed the VAS diet and mice fed the VAD diet. ssDNA-positive cells were counted in 200–500 tubules per testis of control mice and mice fed the VAD diet from 5–90 dpp using IHC sections. Values shown are means ± SEs. *Significant difference between control mice and mice fed the VAD diet (P<0.05, Mann-Whitney U test). (B–C) Appearance of ssDNA-positive cells in the seminiferous epithelium. ssDNA-positive cells were only infrequently detected in testes from control mice at 70 dpp (B). Testes from mice fed the VAD diet contained numerous ssDNA-positive cells at 70 dpp (C). The insert box in panel C highlights the ssDNA-positive cells in the luminal area of the seminiferous tubules. Bars=100 µm.

