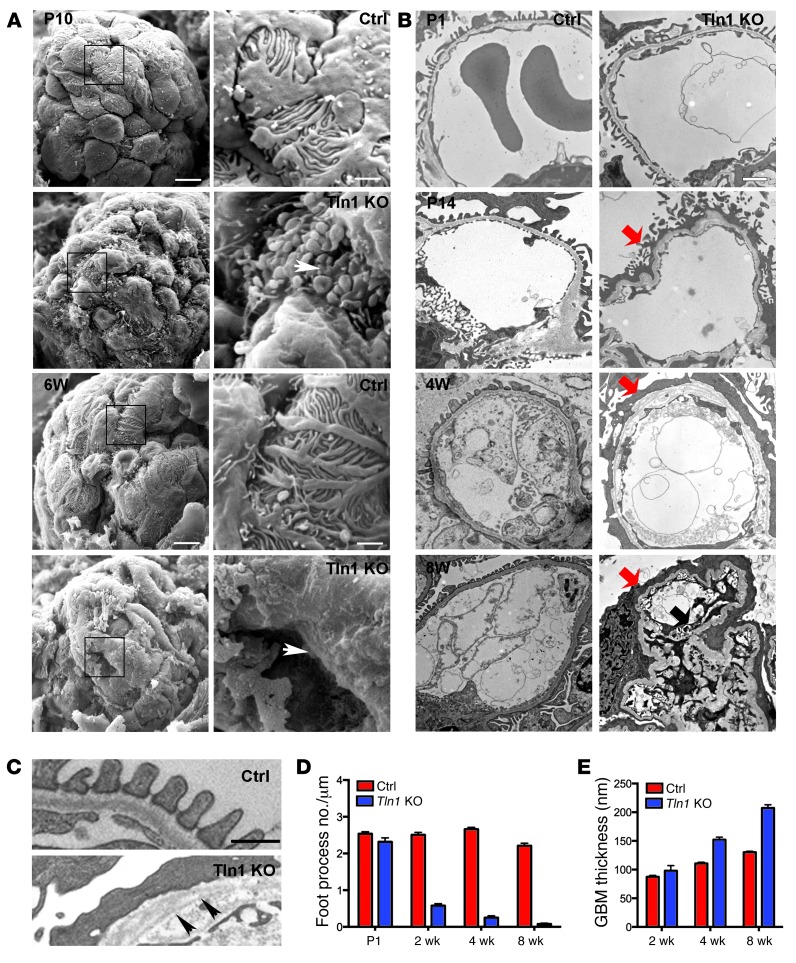
Figure 4. Podocyte-specific loss of talin1 results in foot process effacement.
(A) Scanning electron micrographs illustrating the ultrastructure of glomerulus of control and Pod-Tln1–KO mice at P10 and at 6 weeks. Arrowheads demonstrate loss of foot process interdigitations. Scale bars: 5 μm (left panels); 1 μm (right panels). (B) Transmission electron micrographs illustrating foot process effacement by 2 weeks of age (P1, P14, 4 weeks, and 8 weeks). Scale bar: 1 μm. The red arrows depict foot process effacement while the black arrow depicts mesangial expansion. (C) High-magnification micrographs from control and mutant glomeruli showing thickening and splitting of the basement membrane (4 weeks after birth), as indicated by the arrowheads. Scale bar: 200 nm. Note the effacement (podocyte collapsing on its basement membrane in the Pod-Tln1–KO mice). (D) Quantification of the number of foot processes per micrometer of GBM in the control and Pod-Tln1–KO mice at various ages. n = 2 mice at each time point. (E) Quantification of GBM thickness in the control and Pod-Tln1–KO mice at various ages. n = 2 mice at each time point.

