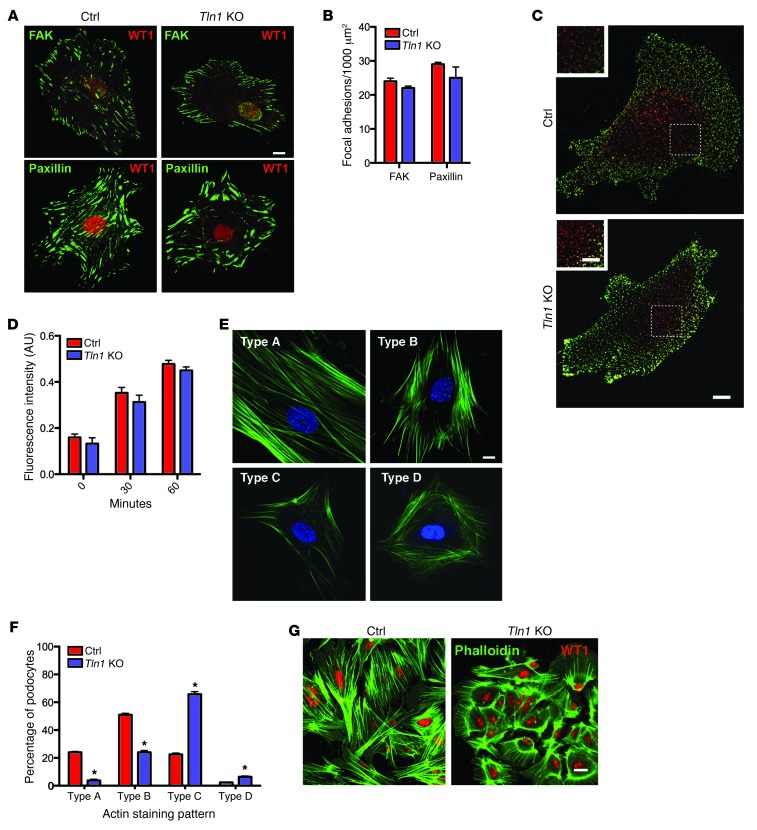
Figure 6. Actin stress fibers are reduced in Pod-Tln1–KO podocytes.
(A) Representative images of paxillin and FAK in focal adhesions in isolated podocytes from control and Pod-Tln1–KO mice. Scale bar: 10 μm. (B) Quantification of focal adhesions represented as focal adhesions/1000 μm2 of podocyte cell area in control and Pod-Tln1–KO podocytes. 25 cells were analyzed in each experiment for control and Pod-Tln1–KO podocytes. n = 3 experiments. (C) Representative image of internalized (red) versus cell surface CD8-nephrin chimera in control and Tln1-KO podocytes at 60 minutes. Scale bar: 10 μm; 3 μm (inset). (D) Quantification of the data shown in C. (n = 3 experiments, 25 cells evaluated per experiment). (E) Representative images of different types of phalloidin staining patterns observed in isolated control podocytes. Scale bar: 10 μm. (F) Quantification of phalloidin staining in control and Pod-Tln1–KO podocytes scored by an observer blind to the genotype. The Pod-Tln1–KO podocytes had fewer cells with types A (>90% of cell area filled with thick cables) and B (at least 2 thick cables running under nucleus and rest of cell area filled with fine cables) staining patterns and more in the type C (no thick cables, but some cables present) and type D (no cables visible in the central area of the cell) pattern when compared with control podocytes. n = 3 experiments. *P < 0.001. (G) Representative image of confluent control and Pod-Tln1–KO podocytes stained with phalloidin and WT1. Scale bar: 30 μm.

