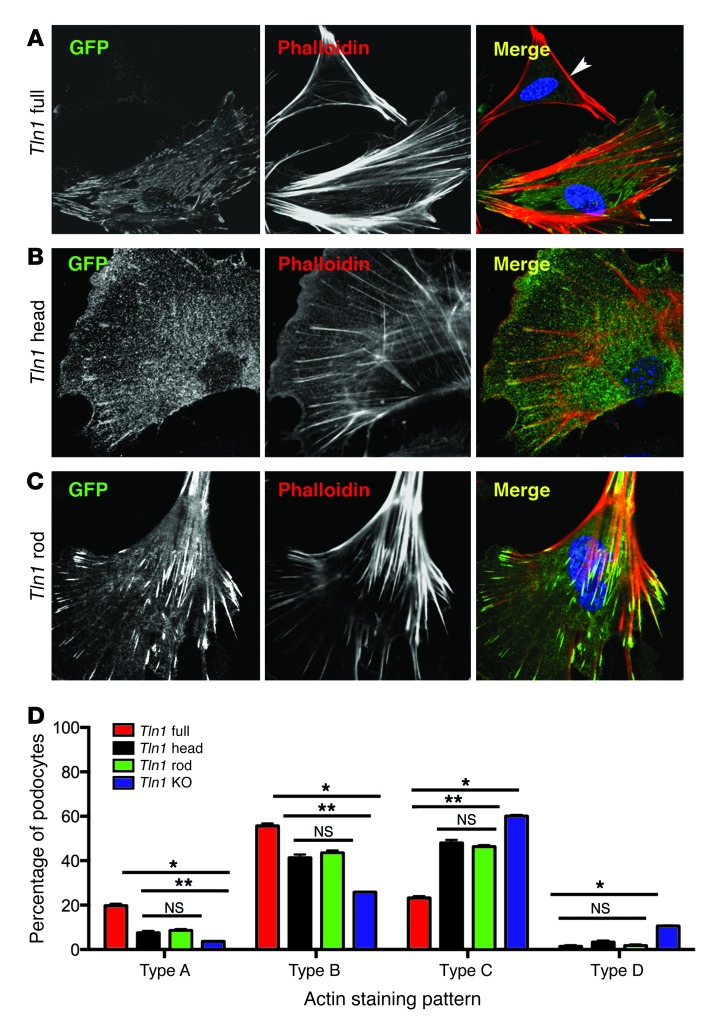
Figure 7. Reexpression of full-length GFP-Tln1 in Pod-Tln1–KO podocytes results in stress fiber reconstitution.
(A–C) Representative images of phalloidin staining (red) following reexpression of GFP-Tln1 full-length (residues 1–2541) (A), GFP-Tln1 head (residues 1–435) (B), and GFP-Tln1 rod (residues 435–2541) (C) in Pod-Tln1–KO podocytes. Note loss of stress fibers and prominent cortical actin staining in untransfected Pod-Tln1–KO podocytes (arrowhead). Scale bar: 10 μm. (D) Quantification of phalloidin staining in podocyte-specific Tln1–KO podocytes following reexpression of the different GFP-Tln1 constructs indicated in A–C. n = 4 experiments *P < 0.01, comparing GFP-Tln1 full-length vs. GFP-Tln1 head, GFP-Tln1 rod, or Pod-Tln1–KO podocytes (untransfected); **P < 0.01, GFP-Tln1 head or GFP-Tln1 rod vs. untransfected podocytes.

