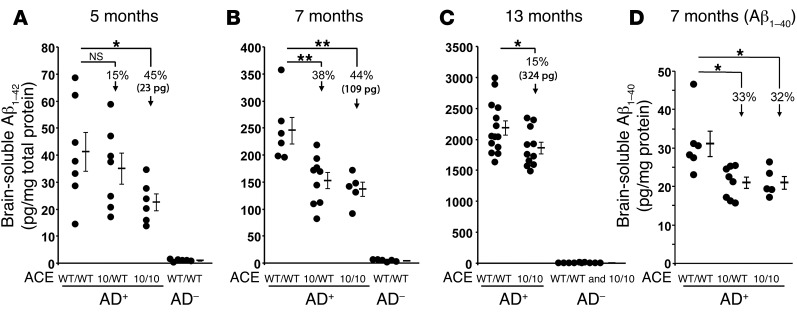
Figure 4. Reduced soluble Aβ levels in AD+ACE10/10 and AD+ACE10/WT mice.
(A–C) ELISA measurements of soluble human Aβ1–42 in the brains of AD+ and AD– mice with the indicated ACE genotypes. Groups of mice were assessed at 5, 7, and 13 months of age. (D) ELISA measurement of soluble human Aβ1–40 from 7-month-old AD+ACEWT/WT, AD+ACE10/WT, and AD+ACE10/10 mice. Data for individual mice as well as for the group means and SEM are shown. Arrows indicate the percentage of reduction in the group means as compared with that in AD+ACEWT/WT mice. Also shown is the absolute reduction in Aβ1–42 (23 pg, 109 pg, and 324 pg) found in AD+ACE10/10 mice as compared with that seen in equivalently aged AD+ACEWT/WT mice. Soluble levels of both Aβ1–42 and Aβ1–40 were lower in AD+ACE10/10 mice than in AD+ACEWT/WT mice, as evidenced by the absolute reduction in Aβ1–42 levels. The difference between AD+ACE10/10 and AD+ACEWT/WT mice increased with age. n = 5–14 mice per group. *P < 0.05; **P < 0.001.

